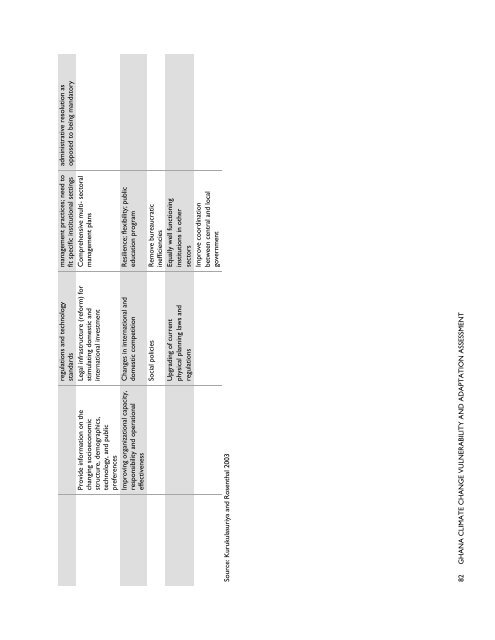
Source: Kurukulasuriya <strong>and</strong> Rosenthal 2003Provide information on thechanging socioeconomicstructure, demographics,technology, <strong>and</strong> publicpreferencesImproving organizational capacity,responsibility <strong>and</strong> operationaleffectivenessregulations <strong>and</strong> technologyst<strong>and</strong>ardsLegal infrastructure (reform) forstimulating domestic <strong>and</strong>international investmentChanges in international <strong>and</strong>domestic competitionmanagement practices; need tofit specific institutional settingsComprehensive multi- sectoralmanagement plansResilience; flexibility; publiceducation programSocial policies Remove bureaucraticinefficienciesUpgrading of currentEqually well functioningphysical planning laws <strong>and</strong>institutions in otherregulationssectorsImprove coordinationbetween central <strong>and</strong> localgovernment82 GHANA CLIMATE CHANGE VULNERABILITY AND ADAPTATION ASSESSMENTadministrative resolution asopposed to being m<strong>and</strong>atory
POPULATION AND ECONOMYGhana contains 10 administrative regions that are divided into 170 districts. 1 As of 2010, Ghana’s population wasestimated at 24,233,431, a 28 percent increase over 2000 population levels (GoG, 2011). Between 2000 <strong>and</strong> 2010,the country had an estimated 2.5 percent average annual population growth rate (Table 5.7). The population isunevenly distributed across the country, with the southern regions generally having much higher populationdensities than the northern regions (Table 5.C.1, Map 5.C.1).Table 5.7 Population Growth Rate by RegionTotal Population Annual inter-censal growth rate (%)1960- 1970- 1984- 2000-Region 1960 1970 1984 2000 2010 1970 1984 2000 2010Western 626,155 770,097 1,157,807 1,924,577 2,325,597 2.1 3.0 3.2 1.9Central 751,392 890,135 1,142,335 1,593,823 2,107,209 1.7 1.8 2.1 2.8GreaterAccra541,933 903,447 1,431,099 2,905,726 3,909,764 5.2 3.3 4.5 3.0Volta 777,285 947,268 1,211,907 1,635,421 2,099,876 2.2 1.8 1.9 2.5Eastern 1,044,090 1,209,828 1,680,890 2,106,696 2,596,013 1.5 2.4 1.4 2.1Ashanti 1,109,133 1,481,698 2,090,100 3,612,950 4,725,046 2.9 2.5 3.5 2.7Brong-Ahafo 587,920 766,509 1,206,608 1,815,408 2,282,128 2.7 3.3 2.5 2.3Northern 531,573 727,618 1,164,583 1,820,806 2,468,577 3.2 3.4 2.8 3.1Upper East 468,638 542,858 772,744 920,089 1,031,478 1.5 2.8 1.1 1.1Upper West 288,706 319,865 438,008 576,583 677,763 1.0 2.3 1.7 1.6Ghana 6,276,815 8,669,313 12,296,081 18,912,079 24,223,431 2.4 2.6 2.7 2.5Sources: Ghana Statistical Service, 2000 Population <strong>and</strong> Housing Census; 2010 Population <strong>and</strong> Housing Census Provisional ResultsThe most densely populated administrative regions are Greater Accra, Central, <strong>and</strong> Ashanti, corresponding to theCoastal Savanna <strong>and</strong> Deciduous Forest ecological zones. The high population densities found in the GreaterAccra Region <strong>and</strong> districts containing regional capitals reflect the fact that 43.8 percent of Ghana’s totalpopulation lived in urban areas in 2000 (a locality having a population greater than 5,000 people, GSS, 2005). TheAkan ethnic group is the largest ethnic group in Ghana, <strong>and</strong> includes the Ashanti (whose power is centered inKumasi, in the Ashanti Region) <strong>and</strong> Fante (whose power is centered in Cape Coast, in the Central Region). Othermajor ethnic groups are the Dabomba of the north, the Ewe of the east, the Ga <strong>and</strong> Adangbe of the south, <strong>and</strong>the Guan of the northeast.1 In the late 1980s, Ghana’s districts were reorganized into 110 districts. By 2006, 28 more districts had been created by splitting some of theoriginal districts, for a total of 138. In 2008, new districts were again created, bringing the total to 170, where it st<strong>and</strong>s currently (Wikipedia,Ghana Districts). Because most of the socioeconomic data contained in this report date from before 2006, they are presented for the 110districts.GHANA CLIMATE CHANGE VULNERABILITY AND ADAPTATION ASSESSMENT 83
- Page 1 and 2:
GHANA CLIMATE CHANGEVULNERABILITY A
- Page 3:
GHANACLIMATE CHANGEVULNERABILITY AN
- Page 7 and 8:
ACRONYMSCAADPCBOCCCDCSCEACEPFCFMCIC
- Page 9:
NGONCRCNREGNRMNTFPPAPAMSCPPGRCRAMSA
- Page 13 and 14:
EXECUTIVE SUMMARYCountries in Afric
- Page 15 and 16:
precipitation changes is not very d
- Page 17 and 18:
AGRICULTURE AND LIVELIHOODSAgricult
- Page 19 and 20:
would include concentrating access
- Page 21 and 22:
of transparency pervade the current
- Page 23 and 24:
alternate energy sources (i.e., fos
- Page 25 and 26:
affecting carbon sequestration. Adv
- Page 27 and 28:
Information and analysis needs for
- Page 29 and 30:
1. INTRODUCTIONThe West African cou
- Page 31:
ABFigure 2.1 Two approaches to vuln
- Page 35 and 36:
Mean Annual Temperature (C)2928.528
- Page 37 and 38:
The UNDP-NSCP country-level climate
- Page 39 and 40:
For most eco-climatic zones, five-y
- Page 41 and 42:
increases generally were projected
- Page 43 and 44: Table 3.2 Potential change in tempe
- Page 45 and 46: parameter (temperature and precipit
- Page 47 and 48: emission scenarios gives a decrease
- Page 49 and 50: of finance and economic planning, f
- Page 51 and 52: indigenous people and more recently
- Page 53 and 54: Phase 1 REDD ReadinessConsultations
- Page 55 and 56: SC. A New National Plantation Devel
- Page 57 and 58: to be developed that provide rigoro
- Page 59 and 60: LandownerTable 4.1 Land Ownership i
- Page 61 and 62: ProblemTable 4.2 Problems Associate
- Page 63 and 64: TENURE CONSIDERATIONS IN LIGHT OF C
- Page 65 and 66: the south of the Ashanti Uplands re
- Page 67 and 68: Figure 5.1 Ecological Zones of Ghan
- Page 69 and 70: North latitude. Minia (2008) deline
- Page 71 and 72: Table 5.1 Percentage of producer ho
- Page 73 and 74: over a longer period. With the risk
- Page 75 and 76: LAND SUITABILITYThe CSIR-Soil Resea
- Page 77 and 78: Table 5.3 Crop Suitability by Soil
- Page 79 and 80: MAJOR CROPSMAIZEMaize is the most i
- Page 81 and 82: Source: Chamberlin, 2007, Figure 13
- Page 83 and 84: Total area(ha)MangroveswampTable 5.
- Page 85 and 86: Source: Chamberlin, 2007Figure 5.6
- Page 87 and 88: Farmers who depend on annual rains
- Page 89 and 90: Adjusting timing ofirrigationPricin
- Page 91 and 92: Transportation networkChanging Crop
- Page 93: Lower world food pricesAttitudes to
- Page 97 and 98: Ghana is comprised of crop and live
- Page 99 and 100: URBAN VERSES RURAL LIVELIHOODS 3Liv
- Page 101 and 102: income; non-farm related enterprise
- Page 103 and 104: 6. VULNERABILITY TOCLIMATE CHANGETh
- Page 105 and 106: DESERTIFICATION“Desertification
- Page 107 and 108: In the National Action Plan to Comb
- Page 109 and 110: significantly recovered by the late
- Page 111 and 112: Source: Reich etal., 2001Figure 6.2
- Page 113 and 114: Source: US Geological Survey, (http
- Page 115 and 116: Two other proximate causes of defor
- Page 117 and 118: extreme, fire is essential in fire-
- Page 119 and 120: gill nets constructed from traditio
- Page 121 and 122: upwelling strength) involved in reg
- Page 123 and 124: completely dominate trawl catches b
- Page 125 and 126: have increased substantially due to
- Page 127 and 128: CategoryFishing effort andtechnolog
- Page 129 and 130: (Binet, 1995). Even if the declinin
- Page 131 and 132: METHODSAs described above, to asses
- Page 133 and 134: Indicator DescriptionDistance fromd
- Page 135 and 136: Indicator DescriptionUnimproveddrin
- Page 137 and 138: lowest vulnerability of any distric
- Page 139 and 140: Table 7.2 Social Vulnerability Inde
- Page 141 and 142: Table 7.5 Incidence of poverty (per
- Page 143 and 144: Table 7.6 Ghana District Names, Ref
- Page 145 and 146:
Figure 7.4 Percentage of district p
- Page 147 and 148:
Figure 7.6 Percentage of female-hea
- Page 149 and 150:
Figure 7.8 Percentage of the Distri
- Page 151 and 152:
Figure 7.10 Percentage of District
- Page 153 and 154:
Figure 7.12 Percentage of District
- Page 155 and 156:
Figure 7.14 Percentage of total Dis
- Page 157 and 158:
people residing in thesee regions a
- Page 159 and 160:
CASE STUDY: CLIMATE CHANGE ADAPTATI
- Page 161 and 162:
from friends and family to get by d
- Page 163 and 164:
CASE STUDY: CLIMATE CHANGE ADAPTATI
- Page 165 and 166:
At Mole National Park, managers exp
- Page 167 and 168:
ADAPTING TO CLIMATE CHANGE IN THE N
- Page 169 and 170:
(interview). An opportunity exists
- Page 171 and 172:
Upper West Region, 69.8 percent of
- Page 173 and 174:
Brong-Ahafo Region that entails ref
- Page 175 and 176:
Ghana Limited, 2009). Given the con
- Page 177 and 178:
positive impacts, and has upset com
- Page 179 and 180:
Basin (total area 416,382km 2 ) lie
- Page 181 and 182:
effect. In the drier scenario, the
- Page 183 and 184:
Communities are, rightly or wrongly
- Page 185 and 186:
carbon sequestration and maintenanc
- Page 187 and 188:
Information and analysis needs for
- Page 189 and 190:
Table 11.1 Options for intervention
- Page 191 and 192:
Barriers toAdaptation andMitigation
- Page 193 and 194:
Barriers toAdaptation andMitigation
- Page 195 and 196:
Barriers toAdaptation andMitigation
- Page 197 and 198:
Amanor, K.S. 2001. Share contracts
- Page 199 and 200:
Braimoh, A. and P. Vlek (2006). "So
- Page 201 and 202:
Energy Commission. 2005. Strategic
- Page 203 and 204:
Gyau-Boakye P., and Tumbulto J.W. 2
- Page 205 and 206:
Koranteng, K.A. 1995. The Ghanaian
- Page 207 and 208:
MSE (Ministry of Science and Agricu
- Page 209 and 210:
Rubin, J.A.; Gordon, C.; Amatekpor,
- Page 211 and 212:
Wagner, M.R. and Cobbinah, J.R., 19
- Page 213 and 214:
Date Organization Interviewee Posit
- Page 215 and 216:
Date Organization Interviewee Posit
- Page 217 and 218:
Date Organization Interviewee Posit
- Page 219 and 220:
APPENDIX 2. TEAM MEMBERSName Role B
- Page 221 and 222:
DP - contact person Activity Object
- Page 223 and 224:
DP - contact person Activity Object
- Page 225 and 226:
DP - contact person Activity Object
- Page 227 and 228:
DP - contact person Activity Object
- Page 229 and 230:
OrganizationNameInstitutional objec
- Page 231 and 232:
OrganizationNameInstitutional objec
- Page 233 and 234:
OrganizationNameInstitutional objec
- Page 235 and 236:
OrganizationNameInstitutional objec
- Page 237 and 238:
OrganizationNameInstitutional objec
- Page 239 and 240:
OrganizationNameInstitutional objec
- Page 241 and 242:
APPENDIX 5. SCENARIOS OF TEMPERATUR
- Page 243 and 244:
e. RAIN FOREST ZONEBaseline Mean Te
- Page 245 and 246:
Aug 191.5 16 12.0 -0.1 -0.5 -1.0 19
- Page 247 and 248:
Feb 25.6 3 9.4 -9.1 -29.7 -58.9 23.
- Page 249 and 250:
c. TRANSITIONAL ZONEBaseline Mean T
- Page 251 and 252:
APPENDIX 8. SCENARIOS OF CHANGES IN
- Page 253 and 254:
d. DECIDUOUS FOREST ZONEBaseline Me
- Page 255 and 256:
APPENDIX 9. SCENARIOS OF MEAN SEA S
- Page 258:
U.S. Agency for International Devel