ghana climate change vulnerability and adaptation assessment
ghana climate change vulnerability and adaptation assessment
ghana climate change vulnerability and adaptation assessment
- No tags were found...

Create successful ePaper yourself
Turn your PDF publications into a flip-book with our unique Google optimized e-Paper software.
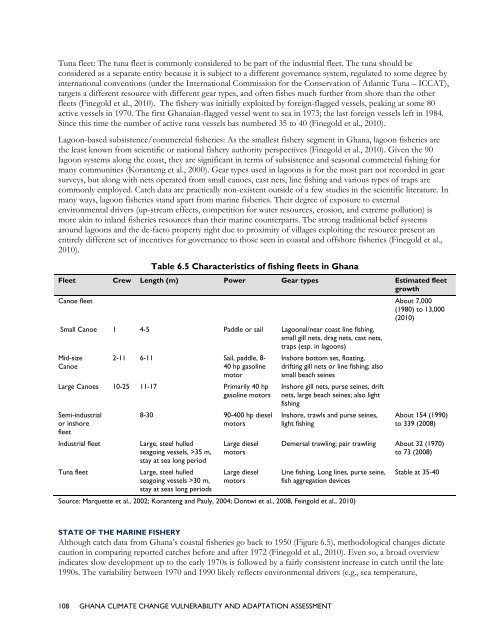
Tuna fleet: The tuna fleet is commonly considered to be part of the industrial fleet. The tuna should beconsidered as a separate entity because it is subject to a different governance system, regulated to some degree byinternational conventions (under the International Commission for the Conservation of Atlantic Tuna – ICCAT),targets a different resource with different gear types, <strong>and</strong> often fishes much further from shore than the otherfleets (Finegold et al., 2010). The fishery was initially exploited by foreign-flagged vessels, peaking at some 80active vessels in 1970. The first Ghanaian-flagged vessel went to sea in 1973; the last foreign vessels left in 1984.Since this time the number of active tuna vessels has numbered 35 to 40 (Finegold et al., 2010).Lagoon-based subsistence/commercial fisheries: As the smallest fishery segment in Ghana, lagoon fisheries arethe least known from scientific or national fishery authority perspectives (Finegold et al., 2010). Given the 90lagoon systems along the coast, they are significant in terms of subsistence <strong>and</strong> seasonal commercial fishing formany communities (Koranteng et al., 2000). Gear types used in lagoons is for the most part not recorded in gearsurveys, but along with nets operated from small canoes, cast nets, line fishing <strong>and</strong> various types of traps arecommonly employed. Catch data are practically non-existent outside of a few studies in the scientific literature. Inmany ways, lagoon fisheries st<strong>and</strong> apart from marine fisheries. Their degree of exposure to externalenvironmental drivers (up-stream effects, competition for water resources, erosion, <strong>and</strong> extreme pollution) ismore akin to inl<strong>and</strong> fisheries resources than their marine counterparts. The strong traditional belief systemsaround lagoons <strong>and</strong> the de-facto property right due to proximity of villages exploiting the resource present anentirely different set of incentives for governance to those seen in coastal <strong>and</strong> offshore fisheries (Finegold et al.,2010).Table 6.5 Characteristics of fishing fleets in GhanaFleet Crew Length (m) Power Gear types Estimated fleetgrowthCanoe fleet About 7,000(1980) to 13,000(2010)Small Canoe 1 4-5 Paddle or sail Lagoonal/near coast line fishing,small gill nets, drag nets, cast nets,traps (esp. in lagoons)Mid-sizeCanoe2-11 6-11 Sail, paddle, 8-40 hp gasolinemotorLarge Canoes 10-25 11-17 Primarily 40 hpgasoline motorsSemi-industrialor inshorefleetIndustrial fleetTuna fleet8-30 90-400 hp dieselmotorsLarge, steel hulledseagoing vessels, >35 m,stay at sea long periodLarge, steel hulledseagoing vessels >30 m,stay at seas long periodsLarge dieselmotorsLarge dieselmotorsInshore bottom set, floating,drifting gill nets or line fishing; alsosmall beach seinesInshore gill nets, purse seines, driftnets, large beach seines; also lightfishingInshore, trawls <strong>and</strong> purse seines,light fishingAbout 154 (1990)to 339 (2008)Demersal trawling; pair trawling About 32 (1970)to 73 (2008)Line fishing, Long lines, purse seine,fish aggregation devicesSource: Marquette et al., 2002; Koranteng <strong>and</strong> Pauly, 2004; Dontwi et al., 2008, Feingold et al., 2010)Stable at 35-40STATE OF THE MARINE FISHERYAlthough catch data from Ghana’s coastal fisheries go back to 1950 (Figure 6.5), methodological <strong>change</strong>s dictatecaution in comparing reported catches before <strong>and</strong> after 1972 (Finegold et al., 2010). Even so, a broad overviewindicates slow development up to the early 1970s is followed by a fairly consistent increase in catch until the late1990s. The variability between 1970 <strong>and</strong> 1990 likely reflects environmental drivers (e.g., sea temperature,108 GHANA CLIMATE CHANGE VULNERABILITY AND ADAPTATION ASSESSMENT