ghana climate change vulnerability and adaptation assessment
ghana climate change vulnerability and adaptation assessment
ghana climate change vulnerability and adaptation assessment
- No tags were found...

Create successful ePaper yourself
Turn your PDF publications into a flip-book with our unique Google optimized e-Paper software.
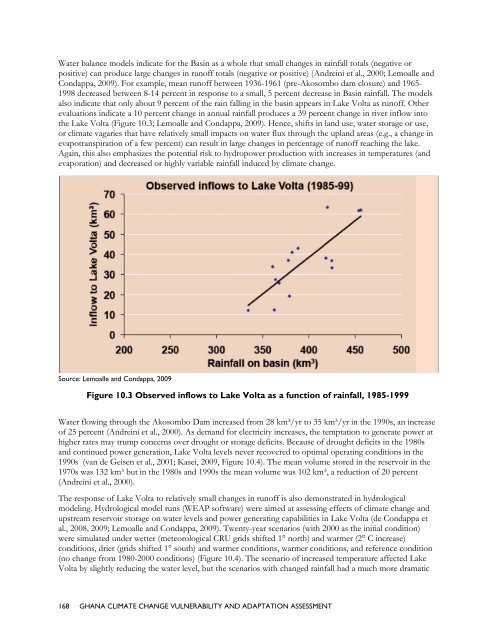
Water balance models indicate for the Basin as a whole that small <strong>change</strong>s in rainfall totals (negative orpositive) can produce large <strong>change</strong>s inrunoff totals (negative or positive) (Andreini et al., 2000; Lemoallee <strong>and</strong>Condappa, 2009). For example, meanrunoff between 1936-19611 (pre-Akosombo dam closure) <strong>and</strong> 1965-1998 decreased between8-14 percentin response to a small, 5 percent decrease in Basin rainfall. The modelsalso indicate that only about 9 percent of the rain falling in the basin appears in Lake Voltaas runoff. Otherevaluations indicate a 10percent <strong>change</strong> in annual rainfall produces a 39 percent <strong>change</strong> in river inflow intothe Lake Volta (Figure 10.3; Lemoallee <strong>and</strong> Condappa, 2009). Hence, shifts in l<strong>and</strong> use, water storage or use,or <strong>climate</strong> vagaries that have relativelysmall impacts on water flux through the upl<strong>and</strong> areas (e.g., a <strong>change</strong> inevapotranspiration of a few percent) can result in large <strong>change</strong>s in percentage of runoff reaching the lake.Again, thisalso emphasizes the potential risk to hydropower production with increases in temperatures (<strong>and</strong>evaporation) <strong>and</strong> decreased or highlyvariable rainfall induced byy <strong>climate</strong> <strong>change</strong>.Source: Lemoalle <strong>and</strong> Condappa, 2009Figure 10.3 Observed inflows to Lake Volta as a function of rainfall, 1985-1999Water flowing through the Akosombo Dam increased from 28 km³/yr to 35 km³/yr in the1990s, an increaseof 25 percent (Andreinii et al., 2000). As dem<strong>and</strong> for electricity increases, the temptation to generate power athigher rates may trump concerns over drought or storage deficits. Because off drought deficits in the 1980s<strong>and</strong> continued power generation, Lake Volta levelsnever recovered to optimal operating conditions in the1990s (van de Geisen et al., 2001; Kasei, 2009, Figure 10.4). Thee mean volume stored in the reservoir inthe1970s was132 km³ but in the 1980s <strong>and</strong> 1990s themean volumee was 102 km³, a reduction of 20 percent(Andreini et al., 2000).The response of Lake Volta to relatively small <strong>change</strong>s in runofff is also demonstrated in hydrologicalmodeling. Hydrologicall model runs (WEAP software) were aimed at assessingeffects of <strong>climate</strong> <strong>change</strong> <strong>and</strong>upstream reservoir storage on water levels <strong>and</strong> power generatingg capabilities in Lake Volta (de Condappaa etal., 2008, 2009; Lemoalle <strong>and</strong> Condappa, 2009). Twenty-year scenarios (with 2000 as the initial condition)were simulated under wetter (meteorological CRU grids shifted 1° north) <strong>and</strong>warmer (2° C increase)conditions, drier (grids shifted 1° south) <strong>and</strong> warmer conditions, warmer conditions, <strong>and</strong> reference condition(no <strong>change</strong> from 1980-2000 conditions) (Figure 10.4). The scenario of increased temperature affected LakeVolta by slightly reducing the water level, but the scenarios withh <strong>change</strong>d rainfall had a much more dramatic168 GHANA CLIMATE CHANGE VULNERABILITY AND ADAPTATION ASSESSMENT