ghana climate change vulnerability and adaptation assessment
ghana climate change vulnerability and adaptation assessment
ghana climate change vulnerability and adaptation assessment
- No tags were found...

Create successful ePaper yourself
Turn your PDF publications into a flip-book with our unique Google optimized e-Paper software.
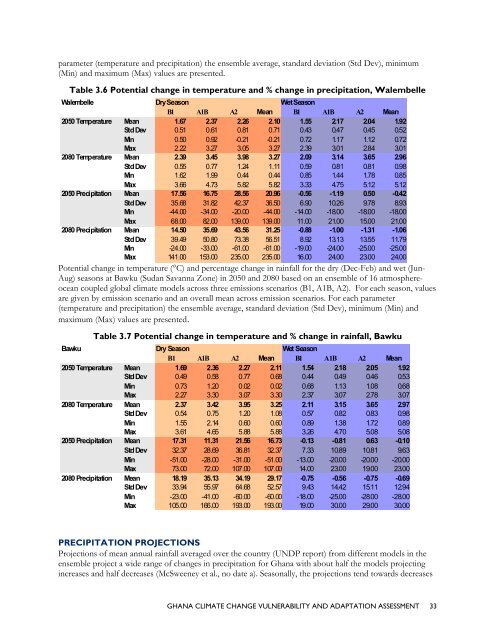
parameter (temperature <strong>and</strong> precipitation) the ensemble average, st<strong>and</strong>ard deviation (Std Dev), minimum(Min) <strong>and</strong> maximum (Max) values are presented.Table 3.6 Potential <strong>change</strong> in temperature <strong>and</strong> % <strong>change</strong> in precipitation, WalembelleWalembelle Dry Season Wet SeasonB1 A1B A2 Mean B1 A1B A2 Mean2050 Temperature Mean 1.67 2.37 2.26 2.10 1.55 2.17 2.04 1.92Std Dev 0.51 0.61 0.81 0.71 0.43 0.47 0.45 0.52Min 0.50 0.92 -0.21 -0.21 0.72 1.17 1.12 0.72Max 2.22 3.27 3.05 3.27 2.39 3.01 2.84 3.012080 Temperature Mean 2.39 3.45 3.98 3.27 2.09 3.14 3.65 2.96Std Dev 0.55 0.77 1.24 1.11 0.59 0.81 0.81 0.98Min 1.62 1.99 0.44 0.44 0.85 1.44 1.78 0.85Max 3.66 4.73 5.82 5.82 3.33 4.75 5.12 5.122050 Precipitation Mean 17.56 16.75 28.56 20.96 -0.56 -1.19 0.50 -0.42Std Dev 35.68 31.82 42.37 36.50 6.90 10.26 9.78 8.93Min -44.00 -34.00 -20.00 -44.00 -14.00 -18.00 -18.00 -18.00Max 68.00 82.00 139.00 139.00 11.00 21.00 15.00 21.002080 Precipitation Mean 14.50 35.69 43.56 31.25 -0.88 -1.00 -1.31 -1.06Std Dev 39.49 50.80 73.38 56.51 8.92 13.13 13.55 11.79Min -24.00 -33.00 -61.00 -61.00 -19.00 -24.00 -25.00 -25.00Max 141.00 153.00 235.00 235.00 16.00 24.00 23.00 24.00Potential <strong>change</strong> in temperature (°C) <strong>and</strong> percentage <strong>change</strong> in rainfall for the dry (Dec-Feb) <strong>and</strong> wet (Jun-Aug) seasons at Bawku (Sudan Savanna Zone) in 2050 <strong>and</strong> 2080 based on an ensemble of 16 atmosphereoceancoupled global <strong>climate</strong> models across three emissions scenarios (B1, A1B, A2). For each season, valuesare given by emission scenario <strong>and</strong> an overall mean across emission scenarios. For each parameter(temperature <strong>and</strong> precipitation) the ensemble average, st<strong>and</strong>ard deviation (Std Dev), minimum (Min) <strong>and</strong>maximum (Max) values are presented.Table 3.7 Potential <strong>change</strong> in temperature <strong>and</strong> % <strong>change</strong> in rainfall, BawkuBawku Dry Season Wet SeasonB1 A1B A2 Mean B1 A1B A2 Mean2050 Temperature Mean 1.69 2.36 2.27 2.11 1.54 2.18 2.05 1.92Std Dev 0.49 0.58 0.77 0.68 0.44 0.49 0.46 0.53Min 0.73 1.20 0.02 0.02 0.68 1.13 1.08 0.68Max 2.27 3.30 3.07 3.30 2.37 3.07 2.78 3.072080 Temperature Mean 2.37 3.42 3.95 3.25 2.11 3.15 3.65 2.97Std Dev 0.54 0.75 1.20 1.08 0.57 0.82 0.83 0.98Min 1.55 2.14 0.60 0.60 0.89 1.38 1.72 0.89Max 3.61 4.65 5.88 5.88 3.26 4.70 5.08 5.082050 Precipitation Mean 17.31 11.31 21.56 16.73 -0.13 -0.81 0.63 -0.10Std Dev 32.37 28.69 36.81 32.37 7.33 10.89 10.81 9.63Min -51.00 -28.00 -31.00 -51.00 -13.00 -20.00 -20.00 -20.00Max 73.00 72.00 107.00 107.00 14.00 23.00 19.00 23.002080 Precipitation Mean 18.19 35.13 34.19 29.17 -0.75 -0.56 -0.75 -0.69Std Dev 33.94 55.97 64.68 52.57 9.43 14.42 15.11 12.94Min -23.00 -41.00 -60.00 -60.00 -18.00 -25.00 -28.00 -28.00Max 105.00 166.00 193.00 193.00 19.00 30.00 29.00 30.00PRECIPITATION PROJECTIONSProjections of mean annual rainfall averaged over the country (UNDP report) from different models in theensemble project a wide range of <strong>change</strong>s in precipitation for Ghana with about half the models projectingincreases <strong>and</strong> half decreases (McSweeney et al., no date a). Seasonally, the projections tend towards decreasesGHANA CLIMATE CHANGE VULNERABILITY AND ADAPTATION ASSESSMENT 33