- Page 1 and 2:
GHANA CLIMATE CHANGEVULNERABILITY A
- Page 3:
GHANACLIMATE CHANGEVULNERABILITY AN
- Page 7 and 8:
ACRONYMSCAADPCBOCCCDCSCEACEPFCFMCIC
- Page 9:
NGONCRCNREGNRMNTFPPAPAMSCPPGRCRAMSA
- Page 13 and 14:
EXECUTIVE SUMMARYCountries in Afric
- Page 15 and 16:
precipitation changes is not very d
- Page 17 and 18:
AGRICULTURE AND LIVELIHOODSAgricult
- Page 19 and 20:
would include concentrating access
- Page 21 and 22:
of transparency pervade the current
- Page 23 and 24:
alternate energy sources (i.e., fos
- Page 25 and 26:
affecting carbon sequestration. Adv
- Page 27 and 28:
Information and analysis needs for
- Page 29 and 30:
1. INTRODUCTIONThe West African cou
- Page 31:
ABFigure 2.1 Two approaches to vuln
- Page 35 and 36:
Mean Annual Temperature (C)2928.528
- Page 37 and 38:
The UNDP-NSCP country-level climate
- Page 39 and 40:
For most eco-climatic zones, five-y
- Page 41 and 42:
increases generally were projected
- Page 43 and 44:
Table 3.2 Potential change in tempe
- Page 45 and 46:
parameter (temperature and precipit
- Page 47 and 48:
emission scenarios gives a decrease
- Page 49 and 50:
of finance and economic planning, f
- Page 51 and 52:
indigenous people and more recently
- Page 53 and 54:
Phase 1 REDD ReadinessConsultations
- Page 55 and 56:
SC. A New National Plantation Devel
- Page 57 and 58:
to be developed that provide rigoro
- Page 59 and 60:
LandownerTable 4.1 Land Ownership i
- Page 61 and 62:
ProblemTable 4.2 Problems Associate
- Page 63 and 64:
TENURE CONSIDERATIONS IN LIGHT OF C
- Page 65 and 66:
the south of the Ashanti Uplands re
- Page 67 and 68:
Figure 5.1 Ecological Zones of Ghan
- Page 69 and 70:
North latitude. Minia (2008) deline
- Page 71 and 72:
Table 5.1 Percentage of producer ho
- Page 73 and 74:
over a longer period. With the risk
- Page 75 and 76:
LAND SUITABILITYThe CSIR-Soil Resea
- Page 77 and 78:
Table 5.3 Crop Suitability by Soil
- Page 79 and 80:
MAJOR CROPSMAIZEMaize is the most i
- Page 81 and 82:
Source: Chamberlin, 2007, Figure 13
- Page 83 and 84:
Total area(ha)MangroveswampTable 5.
- Page 85 and 86:
Source: Chamberlin, 2007Figure 5.6
- Page 87 and 88:
Farmers who depend on annual rains
- Page 89 and 90:
Adjusting timing ofirrigationPricin
- Page 91 and 92:
Transportation networkChanging Crop
- Page 93 and 94:
Lower world food pricesAttitudes to
- Page 95 and 96:
POPULATION AND ECONOMYGhana contain
- Page 97 and 98:
Ghana is comprised of crop and live
- Page 99 and 100:
URBAN VERSES RURAL LIVELIHOODS 3Liv
- Page 101 and 102:
income; non-farm related enterprise
- Page 103 and 104:
6. VULNERABILITY TOCLIMATE CHANGETh
- Page 105 and 106:
DESERTIFICATION“Desertification
- Page 107 and 108:
In the National Action Plan to Comb
- Page 109 and 110:
significantly recovered by the late
- Page 111 and 112:
Source: Reich etal., 2001Figure 6.2
- Page 113 and 114:
Source: US Geological Survey, (http
- Page 115 and 116:
Two other proximate causes of defor
- Page 117 and 118:
extreme, fire is essential in fire-
- Page 119 and 120:
gill nets constructed from traditio
- Page 121 and 122:
upwelling strength) involved in reg
- Page 123 and 124:
completely dominate trawl catches b
- Page 125 and 126:
have increased substantially due to
- Page 127 and 128:
CategoryFishing effort andtechnolog
- Page 129 and 130:
(Binet, 1995). Even if the declinin
- Page 131 and 132:
METHODSAs described above, to asses
- Page 133 and 134:
Indicator DescriptionDistance fromd
- Page 135 and 136:
Indicator DescriptionUnimproveddrin
- Page 137 and 138:
lowest vulnerability of any distric
- Page 139 and 140:
Table 7.2 Social Vulnerability Inde
- Page 141 and 142:
Table 7.5 Incidence of poverty (per
- Page 143 and 144:
Table 7.6 Ghana District Names, Ref
- Page 145 and 146:
Figure 7.4 Percentage of district p
- Page 147 and 148:
Figure 7.6 Percentage of female-hea
- Page 149 and 150:
Figure 7.8 Percentage of the Distri
- Page 151 and 152:
Figure 7.10 Percentage of District
- Page 153 and 154:
Figure 7.12 Percentage of District
- Page 155 and 156:
Figure 7.14 Percentage of total Dis
- Page 157 and 158:
people residing in thesee regions a
- Page 159 and 160:
CASE STUDY: CLIMATE CHANGE ADAPTATI
- Page 161 and 162:
from friends and family to get by d
- Page 163 and 164:
CASE STUDY: CLIMATE CHANGE ADAPTATI
- Page 165 and 166:
At Mole National Park, managers exp
- Page 167 and 168:
ADAPTING TO CLIMATE CHANGE IN THE N
- Page 169 and 170:
(interview). An opportunity exists
- Page 171 and 172:
Upper West Region, 69.8 percent of
- Page 173 and 174:
Brong-Ahafo Region that entails ref
- Page 175 and 176:
Ghana Limited, 2009). Given the con
- Page 177 and 178:
positive impacts, and has upset com
- Page 179 and 180:
Basin (total area 416,382km 2 ) lie
- Page 181 and 182:
effect. In the drier scenario, the
- Page 183 and 184:
Communities are, rightly or wrongly
- Page 185 and 186:
carbon sequestration and maintenanc
- Page 187 and 188:
Information and analysis needs for
- Page 189 and 190:
Table 11.1 Options for intervention
- Page 191 and 192:
Barriers toAdaptation andMitigation
- Page 193 and 194:
Barriers toAdaptation andMitigation
- Page 195 and 196:
Barriers toAdaptation andMitigation
- Page 197 and 198:
Amanor, K.S. 2001. Share contracts
- Page 199 and 200: Braimoh, A. and P. Vlek (2006). "So
- Page 201 and 202: Energy Commission. 2005. Strategic
- Page 203 and 204: Gyau-Boakye P., and Tumbulto J.W. 2
- Page 205 and 206: Koranteng, K.A. 1995. The Ghanaian
- Page 207 and 208: MSE (Ministry of Science and Agricu
- Page 209 and 210: Rubin, J.A.; Gordon, C.; Amatekpor,
- Page 211 and 212: Wagner, M.R. and Cobbinah, J.R., 19
- Page 213 and 214: Date Organization Interviewee Posit
- Page 215 and 216: Date Organization Interviewee Posit
- Page 217 and 218: Date Organization Interviewee Posit
- Page 219 and 220: APPENDIX 2. TEAM MEMBERSName Role B
- Page 221 and 222: DP - contact person Activity Object
- Page 223 and 224: DP - contact person Activity Object
- Page 225 and 226: DP - contact person Activity Object
- Page 227 and 228: DP - contact person Activity Object
- Page 229 and 230: OrganizationNameInstitutional objec
- Page 231 and 232: OrganizationNameInstitutional objec
- Page 233 and 234: OrganizationNameInstitutional objec
- Page 235 and 236: OrganizationNameInstitutional objec
- Page 237 and 238: OrganizationNameInstitutional objec
- Page 239 and 240: OrganizationNameInstitutional objec
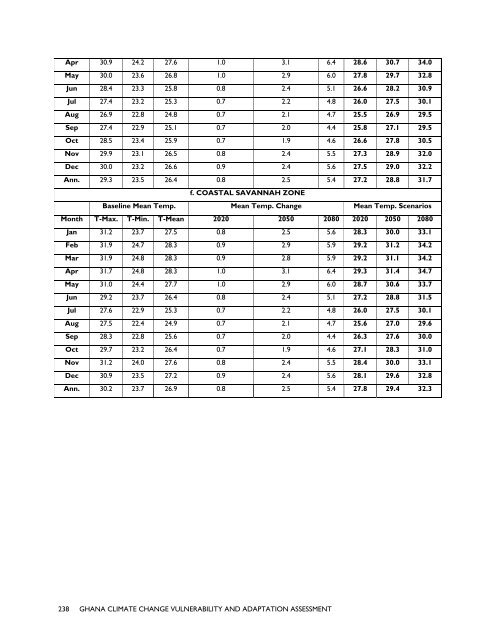
- Page 241 and 242: APPENDIX 5. SCENARIOS OF TEMPERATUR
- Page 243 and 244: e. RAIN FOREST ZONEBaseline Mean Te
- Page 245 and 246: Aug 191.5 16 12.0 -0.1 -0.5 -1.0 19
- Page 247 and 248: Feb 25.6 3 9.4 -9.1 -29.7 -58.9 23.
- Page 249: c. TRANSITIONAL ZONEBaseline Mean T
- Page 253 and 254: d. DECIDUOUS FOREST ZONEBaseline Me
- Page 255 and 256: APPENDIX 9. SCENARIOS OF MEAN SEA S
- Page 258: U.S. Agency for International Devel