ghana climate change vulnerability and adaptation assessment
ghana climate change vulnerability and adaptation assessment
ghana climate change vulnerability and adaptation assessment
- No tags were found...

You also want an ePaper? Increase the reach of your titles
YUMPU automatically turns print PDFs into web optimized ePapers that Google loves.
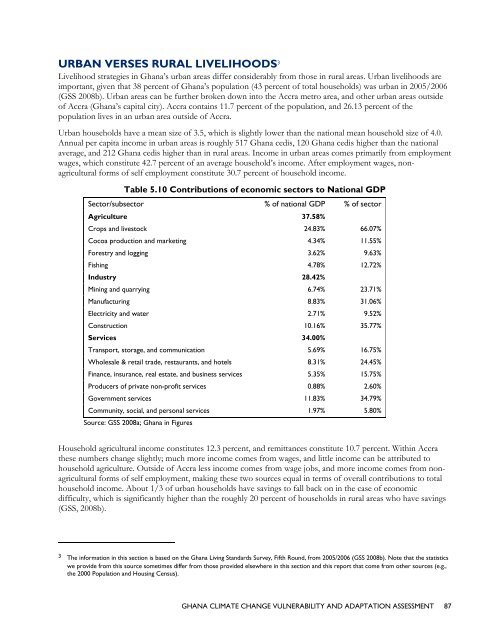
URBAN VERSES RURAL LIVELIHOODS 3Livelihood strategies in Ghana’s urban areas differ considerably from those in rural areas. Urban livelihoods areimportant, given that 38 percent of Ghana’s population (43 percent of total households) was urban in 2005/2006(GSS 2008b). Urban areas can be further broken down into the Accra metro area, <strong>and</strong> other urban areas outsideof Accra (Ghana’s capital city). Accra contains 11.7 percent of the population, <strong>and</strong> 26.13 percent of thepopulation lives in an urban area outside of Accra.Urban households have a mean size of 3.5, which is slightly lower than the national mean household size of 4.0.Annual per capita income in urban areas is roughly 517 Ghana cedis, 120 Ghana cedis higher than the nationalaverage, <strong>and</strong> 212 Ghana cedis higher than in rural areas. Income in urban areas comes primarily from employmentwages, which constitute 42.7 percent of an average household’s income. After employment wages, nonagriculturalforms of self employment constitute 30.7 percent of household income.Table 5.10 Contributions of economic sectors to National GDPSector/subsector % of national GDP % of sectorAgriculture 37.58%Crops <strong>and</strong> livestock 24.83% 66.07%Cocoa production <strong>and</strong> marketing 4.34% 11.55%Forestry <strong>and</strong> logging 3.62% 9.63%Fishing 4.78% 12.72%Industry 28.42%Mining <strong>and</strong> quarrying 6.74% 23.71%Manufacturing 8.83% 31.06%Electricity <strong>and</strong> water 2.71% 9.52%Construction 10.16% 35.77%Services 34.00%Transport, storage, <strong>and</strong> communication 5.69% 16.75%Wholesale & retail trade, restaurants, <strong>and</strong> hotels 8.31% 24.45%Finance, insurance, real estate, <strong>and</strong> business services 5.35% 15.75%Producers of private non-profit services 0.88% 2.60%Government services 11.83% 34.79%Community, social, <strong>and</strong> personal services 1.97% 5.80%Source: GSS 2008a; Ghana in FiguresHousehold agricultural income constitutes 12.3 percent, <strong>and</strong> remittances constitute 10.7 percent. Within Accrathese numbers <strong>change</strong> slightly; much more income comes from wages, <strong>and</strong> little income can be attributed tohousehold agriculture. Outside of Accra less income comes from wage jobs, <strong>and</strong> more income comes from nonagriculturalforms of self employment, making these two sources equal in terms of overall contributions to totalhousehold income. About 1/3 of urban households have savings to fall back on in the case of economicdifficulty, which is significantly higher than the roughly 20 percent of households in rural areas who have savings(GSS, 2008b).3 The information in this section is based on the Ghana Living St<strong>and</strong>ards Survey, Fifth Round, from 2005/2006 (GSS 2008b). Note that the statisticswe provide from this source sometimes differ from those provided elsewhere in this section <strong>and</strong> this report that come from other sources (e.g.,the 2000 Population <strong>and</strong> Housing Census).GHANA CLIMATE CHANGE VULNERABILITY AND ADAPTATION ASSESSMENT 87