Financial Statements4 Taxation continuedThe net deferred tax balance, before the offset of balances within countries, consists of:Property,plant <strong>and</strong>equipment$mIntangibleassets$mPension<strong>and</strong> postretirementbenefits$mIntercompanyinventorytransfers$mUntaxedreserves$mAccruedexpenses$mShareschemes$mLosses <strong>and</strong>Deferred tax creditscapital carriedgains forward$m $mDeferred tax assets at 31 December <strong>20</strong>09 266 47 918 968 – 553 129 – 231 34 3,146Deferred tax liabilities at 31 December <strong>20</strong>09 (474) (2,940) (6) (16) (1,474) (83) – (71) – (37) (5,101)Net deferred tax balance at 31 December <strong>20</strong>09 (<strong>20</strong>8) (2,893) 912 952 (1,474) 470 129 (71) 231 (3) (1,955)Deferred tax assets at 31 December <strong>20</strong>10 357 54 686 988 – 558 127 – 271 25 3,066Deferred tax liabilities at 31 December <strong>20</strong>10 (440) (2,6<strong>20</strong>) (7) (18) (1,531) (10) – (66) – (44) (4,736)Net deferred tax balance at 31 December <strong>20</strong>10 (83) (2,566) 679 970 (1,531) 548 127 (66) 271 (19) (1,670)Deferred tax assets at 31 December <strong>20</strong>11 429 53 699 1,027 – 647 102 – 133 32 3,122Deferred tax liabilities at 31 December <strong>20</strong>11 (<strong>20</strong>9) (2,437) (8) (28) (1,533) (22) – (61) – (45) (4,343)Net deferred tax balance at 31 December <strong>20</strong>11 2<strong>20</strong> (2,384) 691 999 (1,533) 625 102 (61) 133 (13) (1,221)Other$mTotal$mAnalysed in the statement of financial position, after offset of balances within countries, as:Deferred tax assets 1,514 1,475 1,292Deferred tax liabilities (2,735) (3,145) (3,247)Net deferred tax balance (1,221) (1,670) (1,955)<strong>20</strong>11$m<strong>20</strong>10$m<strong>20</strong>09$mUnrecognised deferred tax assetsDeferred tax assets of $169m have not been recognised in respect of deductible temporary differences (<strong>20</strong>10: $128m; <strong>20</strong>09: $104m) becauseit is not probable that future taxable profit will be available against which the Group can utilise the benefits therefrom.5 Earnings per $0.25 Ordinary Share<strong>20</strong>11 <strong>20</strong>10 <strong>20</strong>09Profit for the financial year attributable to equity holders ($m) 9,983 8,053 7,521Basic earnings per Ordinary Share $7.33 $5.60 $5.19Diluted earnings per Ordinary Share $7.30 $5.57 $5.19Weighted average number of Ordinary Shares in issue for basic earnings (millions) 1,361 1,438 1,448Dilutive impact of share options outst<strong>and</strong>ing (millions) 6 8 2Diluted weighted average number of Ordinary Shares in issue (millions) 1,367 1,446 1,450There are no options, warrants or rights outst<strong>and</strong>ing in respect of unissued shares except for employee share option schemes. The number ofoptions outst<strong>and</strong>ing <strong>and</strong> the weighted average exercise price of these options is shown in Note 24. The earnings figures used in the calculationsabove are post-tax.6 Segment information<strong>AstraZeneca</strong> is engaged in a single business activity of pharmaceuticals <strong>and</strong> the Group does not have multiple operating segments. Ourpharmaceuticals business consists of the discovery <strong>and</strong> development of new products, which are then manufactured, marketed <strong>and</strong> sold. All ofthese functional activities take place (<strong>and</strong> are managed) globally on a highly integrated basis. We do not manage these individual functionalareas separately.We consider that the SET is <strong>AstraZeneca</strong>’s chief operating decision-making body (as defined by IFRS 8). The operation of the SET is principallydriven by the management of the commercial operations, R&D, <strong>and</strong> manufacturing <strong>and</strong> supply. The SET also includes Finance, HR <strong>and</strong> CorporateAffairs, Compliance, IS <strong>and</strong> General Counsel representation. All significant operating decisions are taken by the SET. While members of theSET have responsibility for implementation of decisions in their respective areas, operating decision making is at SET level as a whole. Wherenecessary these are implemented through cross-functional sub-committees that consider the Group-wide impact of a new decision. For example,product launch decisions would be initially considered by the SET <strong>and</strong>, on approval, passed to an appropriate sub-team for implementation.The impacts of being able to develop, produce, deliver <strong>and</strong> commercialise a wide range of pharmaceutical products drive the SET decisionmaking process.In assessing performance, the SET reviews financial information on an integrated basis for the Group as a whole, substantially in the form of, <strong>and</strong>on the same basis as, the Group’s IFRS Financial Statements. The high upfront cost of discovering <strong>and</strong> developing new products coupled withthe relatively insignificant <strong>and</strong> stable unit cost of production means that there is not the clear link that exists in many manufacturing businessesbetween the revenue generated on an individual product sale <strong>and</strong> the associated cost <strong>and</strong> hence margin generated on a product. Consequently,the profitability of individual drugs or classes of drugs is not considered a key measure of performance for the business <strong>and</strong> is not monitoredby the SET.Resources are allocated on a Group-wide basis according to need. In particular, capital expenditure, in-licensing, <strong>and</strong> R&D resources areallocated between activities on merit, based on overall therapeutic considerations <strong>and</strong> strategy under the aegis of the Group’s PortfolioInvestment Board to facilitate a Group-wide single combined discovery <strong>and</strong> development strategy. The Group’s acquisitions in the biologics area,MedImmune <strong>and</strong> Cambridge Antibody Technology Group plc (CAT), have been integrated into the existing management structure of<strong>AstraZeneca</strong> both for allocation of resources <strong>and</strong> for assessment <strong>and</strong> monitoring of performance purposes. As such, although biologics is arelatively new technological area for the Group, it does not operate as a separate operating segment.154 Financial Statements<strong>AstraZeneca</strong> <strong>Annual</strong> <strong>Report</strong> <strong>and</strong> <strong>Form</strong> <strong>20</strong>-F <strong>Information</strong> <strong>20</strong>11
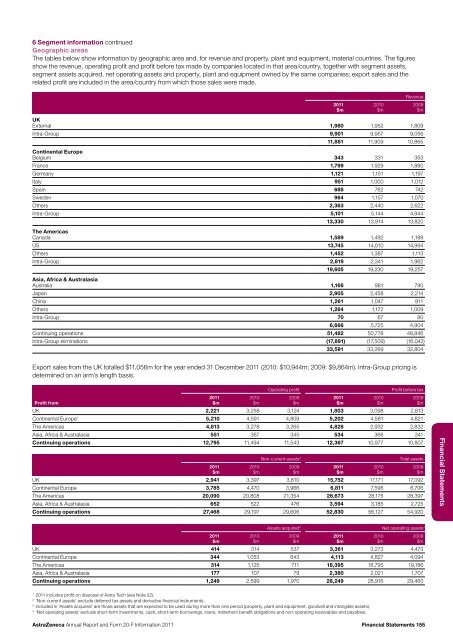
6 Segment information continuedGeographic areasThe tables below show information by geographic area <strong>and</strong>, for revenue <strong>and</strong> property, plant <strong>and</strong> equipment, material countries. The figuresshow the revenue, operating profit <strong>and</strong> profit before tax made by companies located in that area/country, together with segment assets,segment assets acquired, net operating assets <strong>and</strong> property, plant <strong>and</strong> equipment owned by the same companies; export sales <strong>and</strong> therelated profit are included in the area/country from which those sales were made.Revenue<strong>20</strong>11$m<strong>20</strong>10$m<strong>20</strong>09$mUKExternal 1,980 1,952 1,809Intra-Group 9,901 9,957 9,05611,881 11,909 10,865Continental EuropeBelgium 343 331 353France 1,799 1,929 1,880Germany 1,121 1,151 1,197Italy 951 1,000 1,012Spain 688 762 742Sweden 964 1,157 1,070Others 2,363 2,440 2,622Intra-Group 5,101 5,144 4,94413,330 13,914 13,8<strong>20</strong>The AmericasCanada 1,589 1,492 1,188US 13,745 14,010 14,994Others 1,452 1,387 1,113Intra-Group 2,819 2,341 1,96219,605 19,230 19,257Asia, Africa & AustralasiaAustralia 1,166 981 790Japan 2,905 2,458 2,214China 1,261 1,047 811Others 1,264 1,172 1,009Intra-Group 70 67 806,666 5,725 4,904Continuing operations 51,482 50,778 48,846Intra-Group eliminations (17,891) (17,509) (16,042)33,591 33,269 32,804Export sales from the UK totalled $11,056m for the year ended 31 December <strong>20</strong>11 (<strong>20</strong>10: $10,944m; <strong>20</strong>09: $9,864m). Intra-Group pricing isdetermined on an arm’s length basis.Operating profitProfit before taxProfit from<strong>20</strong>11$m<strong>20</strong>10$m<strong>20</strong>09$m<strong>20</strong>11$m<strong>20</strong>10$m<strong>20</strong>09$mUK 2,221 3,258 3,124 1,803 3,098 2,813Continental Europe 1 5,210 4,591 4,809 5,<strong>20</strong>2 4,581 4,821The Americas 4,813 3,278 3,265 4,828 2,932 2,832Asia, Africa & Australasia 551 367 345 534 366 341Continuing operations 12,795 11,494 11,543 12,367 10,977 10,807Non-current assets 2Total assets<strong>20</strong>11$m<strong>20</strong>10$m<strong>20</strong>09$m<strong>20</strong>11$m<strong>20</strong>10$m<strong>20</strong>09$mUK 2,941 3,397 3,810 15,752 17,171 17,092Continental Europe 3,785 4,470 3,966 6,811 7,596 6,706The Americas <strong>20</strong>,090 <strong>20</strong>,808 21,354 26,673 28,175 28,397Asia, Africa & Australasia 652 522 476 3,594 3,185 2,725Continuing operations 27,468 29,197 29,606 52,830 56,127 54,9<strong>20</strong>Financial Statements<strong>20</strong>11$m<strong>20</strong>10$mAssets acquired 3 Net operating assets 4UK 414 314 537 3,361 3,273 4,473Continental Europe 344 1,053 643 4,113 4,827 4,094The Americas 314 1,125 711 18,395 18,795 19,186Asia, Africa & Australasia 177 107 79 2,380 2,021 1,707Continuing operations 1,249 2,599 1,970 28,249 28,916 29,460<strong>20</strong>09$m<strong>20</strong>11$m<strong>20</strong>10$m<strong>20</strong>09$m1<strong>20</strong>11 includes profit on disposal of Astra Tech (see Note 22).2‘Non-current assets’ exclude deferred tax assets <strong>and</strong> derivative financial instruments.3Included in ‘Assets acquired’ are those assets that are expected to be used during more than one period (property, plant <strong>and</strong> equipment, goodwill <strong>and</strong> intangible assets).4‘Net operating assets’ exclude short-term investments, cash, short-term borrowings, loans, retirement benefit obligations <strong>and</strong> non-operating receivables <strong>and</strong> payables.<strong>AstraZeneca</strong> <strong>Annual</strong> <strong>Report</strong> <strong>and</strong> <strong>Form</strong> <strong>20</strong>-F <strong>Information</strong> <strong>20</strong>11 Financial Statements 155