Financial ReviewCapitalisation <strong>and</strong> shareholder returnDividend for <strong>20</strong>11$ Pence SEK Payment dateFirst interim dividend 0.85 51.9 5.33 12 September <strong>20</strong>11Second interim dividend 1.95 123.6 13.21 19 March <strong>20</strong>12Total 2.80 175.5 18.54Summary of shareholder distributionsSharesrepurchased(million)Cost$mDividend pershare$Dividendcost$mShareholderdistributions$m<strong>20</strong>00 9.4 352 0.70 1,236 1,588<strong>20</strong>01 23.5 1,080 0.70 1,225 2,305<strong>20</strong>02 28.3 1,190 0.70 1,<strong>20</strong>6 2,396<strong>20</strong>03 27.2 1,154 0.795 1,350 2,504<strong>20</strong>04 50.1 2,212 0.94 1,555 3,767<strong>20</strong>05 67.7 3,001 1.30 2,068 5,069<strong>20</strong>06 72.2 4,147 1.72 2,649 6,796<strong>20</strong>07 79.9 4,170 1.87 2,740 6,910<strong>20</strong>08 13.6 610 2.05 2,971 3,581<strong>20</strong>09 – – 2.30 3,339 3,339<strong>20</strong>10 53.7 2,604 2.55 3,604 6,<strong>20</strong>8<strong>20</strong>11 127.4 6,015 2.80 3,678 1 9,693Total 553.0 26,535 18.425 27,621 54,1561Total dividend cost estimated based upon number of shares in issue at 31 December <strong>20</strong>11.CapitalisationThe total number of shares in issue at 31 December <strong>20</strong>11 was1,292 million. 10.7 million shares were issued in consideration ofshare option exercises for a total of $409 million. Share repurchasesamounted to 127.4 million Ordinary Shares at a cost of $6,015 million.Shareholders’ equity increased by a net $33 million to $23,246 millionat the year end. Non-controlling interests increased to $226 million(<strong>20</strong>10: $197 million).Dividend <strong>and</strong> share repurchasesIn recognition of the Group’s strong balance sheet, sustainablesignificant cash flow <strong>and</strong> the Board’s confidence in the strategicdirection <strong>and</strong> long-term prospects for the business, the Board hasadopted a progressive dividend policy, intending to maintain or growthe dividend each year.The Board has recommended a 5% increase in the second interimdividend to $1.95 (123.6 pence, 13.21 SEK) to be paid on 19 March<strong>20</strong>12. This brings the full year dividend to $2.80 (175.5 pence pershare, 18.54 SEK), an increase of 10%.In <strong>20</strong>10, the Group recommenced its share repurchase programme.The Group completed net share repurchases of $5,606 million in <strong>20</strong>11(<strong>20</strong>10: $2,110 million). The Board has announced that the Group intendsto complete net share repurchases in the amount of $4.5 billion during<strong>20</strong>12, subject to market conditions <strong>and</strong> business needs.In setting the distribution policy <strong>and</strong> the overall financial strategy, theBoard’s aim is to continue to strike a balance between the interestsof the business, our financial creditors <strong>and</strong> our shareholders. Afterproviding for business investment, funding the progressive dividendpolicy <strong>and</strong> meeting our debt service obligations, the Board will keepunder review the opportunity to return cash in excess of theserequirements to shareholders through periodic share repurchases.<strong>AstraZeneca</strong> assumes that the global biopharmaceutical industrycan grow at least in line with real GDP over the planning horizon.While downward pressures on revenue from government interventionsin the marketplace have intensified, <strong>AstraZeneca</strong>’s assessmentremains that, as yet, these do not yet constitute a sustained ‘stepchange’in trend. The assumptions going forward for revenue, margins<strong>and</strong> cash flow assume no material mergers, acquisitions or disposals.In addition, our plans assume no premature loss of exclusivity for key<strong>AstraZeneca</strong> products.It is expected that revenue in <strong>20</strong>12 will continue to be affectedby government interventions on pricing, <strong>and</strong> ongoing genericcompetition, including the anticipated loss of market exclusivity forSeroquel IR <strong>and</strong> Atac<strong>and</strong> in global markets, as well as for Crestorin Canada.Over the last several years, the Group has undertaken significantrestructuring initiatives aimed at reshaping the cost base to improvelong-term competitiveness. The second phase of restructuring,which was announced in January <strong>20</strong>10, comprised a significantchange programme in R&D as well as additional productivityimprovement initiatives in the supply chain <strong>and</strong> SG&A. The first twophases of the restructuring programme are now largely complete ata cumulative cost of $4.6 billion. This programme will deliver annualbenefits to the Group by <strong>20</strong>14. In February <strong>20</strong>12, the Groupannounced the next phase of restructuring. Further details are setout in the Our strategic priorities to <strong>20</strong>14 section from page 21.A planning assumption remains that continued productivityimprovements (including successful completion of restructuringinitiatives), will aid the achievement of levels of revenue <strong>and</strong> marginsto generate the requisite operating cash flow over the planning periodto support the reinvestment needs of the business, debt serviceobligations <strong>and</strong> shareholder distributions.Future prospectsAs described earlier in our <strong>Annual</strong> <strong>Report</strong>, the coming years will bechallenging for the industry <strong>and</strong> for <strong>AstraZeneca</strong> as its revenue basetransitions through a period of exclusivity losses <strong>and</strong> new productlaunches. <strong>AstraZeneca</strong> makes high-level planning assumptions forrevenue evolution, margins, cash flow <strong>and</strong> business reinvestment tohelp guide the management of the business.90 Financial Review<strong>AstraZeneca</strong> <strong>Annual</strong> <strong>Report</strong> <strong>and</strong> <strong>Form</strong> <strong>20</strong>-F <strong>Information</strong> <strong>20</strong>11
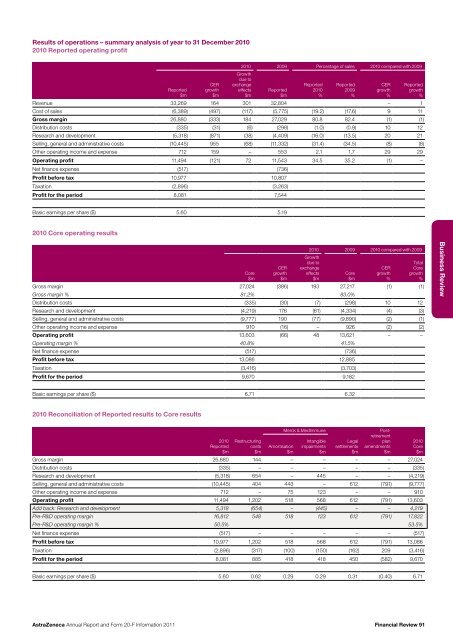
Results of operations – summary analysis of year to 31 December <strong>20</strong>10<strong>20</strong>10 <strong>Report</strong>ed operating profit<strong>Report</strong>ed$mCERgrowth$m<strong>20</strong>10 <strong>20</strong>09 Percentage of sales <strong>20</strong>10 compared with <strong>20</strong>09Growthdue toexchangeeffects$m<strong>Report</strong>ed$m<strong>Report</strong>ed<strong>20</strong>10%<strong>Report</strong>ed<strong>20</strong>09%CERgrowth%<strong>Report</strong>edgrowth%Revenue 33,269 164 301 32,804 – 1Cost of sales (6,389) (497) (117) (5,775) (19.2) (17.6) 9 11Gross margin 26,880 (333) 184 27,029 80.8 82.4 (1) (1)Distribution costs (335) (31) (6) (298) (1.0) (0.9) 10 12Research <strong>and</strong> development (5,318) (871) (38) (4,409) (16.0) (13.5) <strong>20</strong> 21Selling, general <strong>and</strong> administrative costs (10,445) 955 (68) (11,332) (31.4) (34.5) (8) (8)Other operating income <strong>and</strong> expense 712 159 – 553 2.1 1.7 29 29Operating profit 11,494 (121) 72 11,543 34.5 35.2 (1) –Net finance expense (517) (736)Profit before tax 10,977 10,807Taxation (2,896) (3,263)Profit for the period 8,081 7,544Basic earnings per share ($) 5.60 5.19<strong>20</strong>10 Core operating resultsCore$mCERgrowth$m<strong>20</strong>10 <strong>20</strong>09 <strong>20</strong>10 compared with <strong>20</strong>09Growthdue toexchangeeffects$mGross margin 27,024 (386) 193 27,217 (1) (1)Gross margin % 81.2% 83.0%Distribution costs (335) (30) (7) (298) 10 12Research <strong>and</strong> development (4,219) 176 (61) (4,334) (4) (3)Selling, general <strong>and</strong> administrative costs (9,777) 190 (77) (9,890) (2) (1)Other operating income <strong>and</strong> expense 910 (16) – 926 (2) (2)Operating profit 13,603 (66) 48 13,621 – –Operating margin % 40.8% 41.5%Net finance expense (517) (736)Profit before tax 13,086 12,885Taxation (3,416) (3,703)Profit for the period 9,670 9,182Core$mCERgrowth%TotalCoregrowth%Business ReviewBasic earnings per share ($) 6.71 6.32<strong>20</strong>10 Reconciliation of <strong>Report</strong>ed results to Core results<strong>20</strong>10<strong>Report</strong>ed$mRestructuringcosts$mAmortisation$mMerck & MedImmuneIntangibleimpairments$mLegalsettlements$mPostretirementplanamendments$mGross margin 26,880 144 – – – – 27,024Distribution costs (335) – – – – – (335)Research <strong>and</strong> development (5,318) 654 – 445 – – (4,219)Selling, general <strong>and</strong> administrative costs (10,445) 404 443 – 612 (791) (9,777)Other operating income <strong>and</strong> expense 712 – 75 123 – – 910Operating profit 11,494 1,<strong>20</strong>2 518 568 612 (791) 13,603Add back: Research <strong>and</strong> development 5,318 (654) – (445) – – 4,219Pre-R&D operating margin 16,812 548 518 123 612 (791) 17,822Pre-R&D operating margin % 50.5% 53.5%Net finance expense (517) – – – – – (517)Profit before tax 10,977 1,<strong>20</strong>2 518 568 612 (791) 13,086Taxation (2,896) (317) (100) (150) (162) <strong>20</strong>9 (3,416)Profit for the period 8,081 885 418 418 450 (582) 9,670<strong>20</strong>10Core$mBasic earnings per share ($) 5.60 0.62 0.29 0.29 0.31 (0.40) 6.71<strong>AstraZeneca</strong> <strong>Annual</strong> <strong>Report</strong> <strong>and</strong> <strong>Form</strong> <strong>20</strong>-F <strong>Information</strong> <strong>20</strong>11Financial Review 91