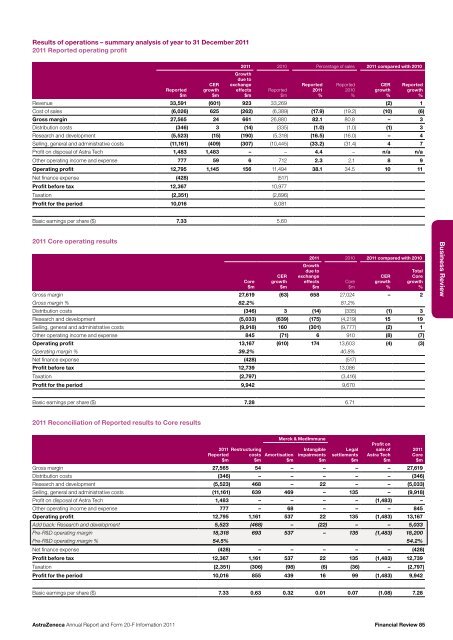
Financial ReviewMeasuring performanceThe following measures are referred to when reporting on ourperformance both in absolute terms but more often in comparisonto earlier years in this Financial Review:> <strong>Report</strong>ed performance. <strong>Report</strong>ed performance takes intoaccount all the factors (including those which we cannotinfluence, principally currency exchange rates) that have affectedthe results of our business as reflected in our Group FinancialStatements prepared in accordance with IFRSs as adopted bythe EU <strong>and</strong> as issued by the IASB.> Core financial measures. These are non-GAAP measuresbecause, unlike <strong>Report</strong>ed performance, they cannot be deriveddirectly from the information in the Group’s Financial Statements.These measures are adjusted to exclude certain significantitems, such as charges <strong>and</strong> provisions related to our globalrestructuring programmes, amortisation <strong>and</strong> impairment of thesignificant intangibles relating to the acquisition of MedImmunein <strong>20</strong>07, the amortisation <strong>and</strong> impairment of the significantintangibles relating to our current <strong>and</strong> future exit arrangementswith Merck in the US <strong>and</strong> other specified items. See the <strong>20</strong>11Reconciliation of <strong>Report</strong>ed results to Core results table on page85 for a reconciliation of <strong>Report</strong>ed to Core performance.> Constant exchange rate (CER) growth rates. These arealso non-GAAP measures. These measures remove the effectsof currency movements (by retranslating the current year’sperformance at previous year’s exchange rates <strong>and</strong> adjustingfor other exchange effects, including hedging). A reconciliationof the <strong>Report</strong>ed results adjusted for the impact of currencymovements is provided in the <strong>20</strong>11 <strong>Report</strong>ed operating profittable on page 85.> Gross <strong>and</strong> operating profit margin percentages, <strong>and</strong>Core pre-R&D operating margin. These measures set outthe progression of key performance margins <strong>and</strong> illustrate theoverall quality of the business. Core pre-R&D operating marginis a non-GAAP measure of our Core financial performance.A reconciliation of Core pre-R&D operating margin to ouroperating profit is provided on pages 85 <strong>and</strong> 91.> Prescription volumes <strong>and</strong> trends for key products.These measures can represent the real business growth <strong>and</strong>the progress of individual products better <strong>and</strong> more immediatelythan invoiced sales.> Net funds/debt. This represents our cash <strong>and</strong> cash equivalents,current investments <strong>and</strong> derivative financial instruments lessinterest-bearing loans <strong>and</strong> borrowings.CER measures allow us to focus on the changes in sales <strong>and</strong>expenses driven by volume, prices <strong>and</strong> cost levels relative to theprior period. Sales <strong>and</strong> cost growth expressed in CER allowsmanagement to underst<strong>and</strong> the true local movement in sales <strong>and</strong>costs, in order to compare recent trends <strong>and</strong> relative return oninvestment. CER growth rates can be used to analyse sales in anumber of ways but, most often, we consider CER growth byproducts <strong>and</strong> groups of products, <strong>and</strong> by countries <strong>and</strong> regions.CER sales growth can be further analysed into the impact of salesvolumes <strong>and</strong> selling price. Similarly, CER cost growth helps us tofocus on the real local change in costs so that we can manage thecost base effectively.We believe that disclosing Core financial <strong>and</strong> growth measures inaddition to our <strong>Report</strong>ed financial information enhances investors’ability to evaluate <strong>and</strong> analyse the underlying financial performanceof our ongoing business <strong>and</strong> the related key business drivers. Theadjustments made to our <strong>Report</strong>ed financial information in order toshow Core financial measures illustrate clearly, <strong>and</strong> on a year-onyearor period-by-period basis, the impact upon our performancecaused by factors such as changes in sales <strong>and</strong> expenses driven byvolume, prices <strong>and</strong> cost levels relative to such prior years or periods.As shown in the <strong>20</strong>11 Reconciliation of <strong>Report</strong>ed results to Coreresults table on page 85, our reconciliation of <strong>Report</strong>ed financialinformation to Core financial measures includes a breakdown of theitems for which our <strong>Report</strong>ed financial information is adjusted <strong>and</strong> afurther breakdown of those items by specific line item as such itemsare reflected in our <strong>Report</strong>ed income statement. This illustrates thesignificant items that are excluded from Core financial measures<strong>and</strong> their impact on our <strong>Report</strong>ed financial information, both as awhole <strong>and</strong> in respect of specific line items.Core pre-R&D operating margin is our Core operating marginbefore research <strong>and</strong> development costs recorded in the year.This measure reflects Core operating performance beforereinvestment in internal research <strong>and</strong> development.Management presents these results externally to meet investors’requirements for transparency <strong>and</strong> clarity. Core financial measuresare also used internally in the management of our businessperformance, in our budgeting process <strong>and</strong> when determiningcompensation.Core financial measures are non-GAAP adjusted measures. Allitems for which Core financial measures are adjusted are includedin our <strong>Report</strong>ed financial information as they represent actual costsof our business in the periods presented. As a result, Core financialmeasures merely allow investors to differentiate between differentkinds of costs <strong>and</strong> they should not be used in isolation. You shouldalso refer to our <strong>Report</strong>ed financial information in the <strong>20</strong>11 <strong>Report</strong>edoperating profit table on page 85, our reconciliation of Core financialmeasures to <strong>Report</strong>ed financial information in the Reconciliationof <strong>Report</strong>ed results to Core results table on page 85, <strong>and</strong> to theResults of operations – summary analysis of year to 31 December<strong>20</strong>10 section from page 91 for our discussion of comparative<strong>Report</strong>ed growth measures that reflect all factors that affect ourbusiness. Our determination of non-GAAP measures, <strong>and</strong> ourpresentation of them within this financial information, may differfrom similarly titled non-GAAP measures of other companies.The SET retains strategic management of the costs excludedfrom <strong>Report</strong>ed financial information in arriving at Core financialmeasures, tracking their impact on <strong>Report</strong>ed operating profit <strong>and</strong>EPS, with operational management being delegated on a case-bycasebasis to ensure clear accountability <strong>and</strong> consistency for eachcost category.84 Financial Review<strong>AstraZeneca</strong> <strong>Annual</strong> <strong>Report</strong> <strong>and</strong> <strong>Form</strong> <strong>20</strong>-F <strong>Information</strong> <strong>20</strong>11
Results of operations – summary analysis of year to 31 December <strong>20</strong>11<strong>20</strong>11 <strong>Report</strong>ed operating profit<strong>Report</strong>ed$mCERgrowth$mGrowthdue toexchangeeffects$m<strong>20</strong>11 <strong>20</strong>10 Percentage of sales <strong>20</strong>11 compared with <strong>20</strong>10<strong>Report</strong>ed$m<strong>Report</strong>ed<strong>20</strong>11%<strong>Report</strong>ed<strong>20</strong>10%CERgrowth%<strong>Report</strong>edgrowth%Revenue 33,591 (601) 923 33,269 (2) 1Cost of sales (6,026) 625 (262) (6,389) (17.9) (19.2) (10) (6)Gross margin 27,565 24 661 26,880 82.1 80.8 – 3Distribution costs (346) 3 (14) (335) (1.0) (1.0) (1) 3Research <strong>and</strong> development (5,523) (15) (190) (5,318) (16.5) (16.0) – 4Selling, general <strong>and</strong> administrative costs (11,161) (409) (307) (10,445) (33.2) (31.4) 4 7Profit on disposal of Astra Tech 1,483 1,483 – – 4.4 – n/a n/aOther operating income <strong>and</strong> expense 777 59 6 712 2.3 2.1 8 9Operating profit 12,795 1,145 156 11,494 38.1 34.5 10 11Net finance expense (428) (517)Profit before tax 12,367 10,977Taxation (2,351) (2,896)Profit for the period 10,016 8,081Basic earnings per share ($) 7.33 5.60<strong>20</strong>11 Core operating resultsCore$mCERgrowth$mGrowthdue toexchangeeffects$m<strong>20</strong>11 <strong>20</strong>10 <strong>20</strong>11 compared with <strong>20</strong>10Gross margin 27,619 (63) 658 27,024 – 2Gross margin % 82.2% 81.2%Distribution costs (346) 3 (14) (335) (1) 3Research <strong>and</strong> development (5,033) (639) (175) (4,219) 15 19Selling, general <strong>and</strong> administrative costs (9,918) 160 (301) (9,777) (2) 1Other operating income <strong>and</strong> expense 845 (71) 6 910 (8) (7)Operating profit 13,167 (610) 174 13,603 (4) (3)Operating margin % 39.2% 40.8%Net finance expense (428) (517)Profit before tax 12,739 13,086Taxation (2,797) (3,416)Profit for the period 9,942 9,670Core$mCERgrowth%TotalCoregrowth%Business ReviewBasic earnings per share ($) 7.28 6.71<strong>20</strong>11 Reconciliation of <strong>Report</strong>ed results to Core results<strong>20</strong>11 Restructuring<strong>Report</strong>ed costs$m$mMerck & MedImmuneAmortisation$mIntangibleimpairments$mLegalsettlements$mProfit onsale ofAstra Tech$mGross margin 27,565 54 – – – – 27,619Distribution costs (346) – – – – – (346)Research <strong>and</strong> development (5,523) 468 – 22 – – (5,033)Selling, general <strong>and</strong> administrative costs (11,161) 639 469 – 135 – (9,918)Profit on disposal of Astra Tech 1,483 – – – – (1,483) –Other operating income <strong>and</strong> expense 777 – 68 – – – 845Operating profit 12,795 1,161 537 22 135 (1,483) 13,167Add back: Research <strong>and</strong> development 5,523 (468) – (22) – – 5,033Pre-R&D operating margin 18,318 693 537 – 135 (1,483) 18,<strong>20</strong>0Pre-R&D operating margin % 54.5% 54.2%Net finance expense (428) – – – – – (428)Profit before tax 12,367 1,161 537 22 135 (1,483) 12,739Taxation (2,351) (306) (98) (6) (36) – (2,797)Profit for the period 10,016 855 439 16 99 (1,483) 9,942<strong>20</strong>11Core$mBasic earnings per share ($) 7.33 0.63 0.32 0.01 0.07 (1.08) 7.28<strong>AstraZeneca</strong> <strong>Annual</strong> <strong>Report</strong> <strong>and</strong> <strong>Form</strong> <strong>20</strong>-F <strong>Information</strong> <strong>20</strong>11Financial Review 85


