AstraZeneca Annual Report and Form 20-F Information 2011
AstraZeneca Annual Report and Form 20-F Information 2011
AstraZeneca Annual Report and Form 20-F Information 2011
- No tags were found...
Create successful ePaper yourself
Turn your PDF publications into a flip-book with our unique Google optimized e-Paper software.
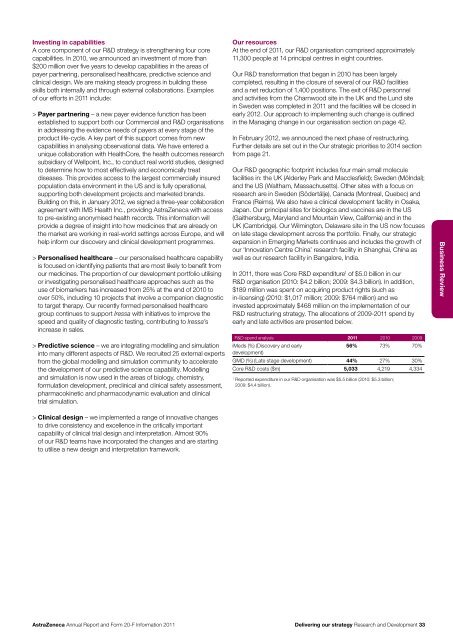
Investing in capabilitiesA core component of our R&D strategy is strengthening four corecapabilities. In <strong>20</strong>10, we announced an investment of more than$<strong>20</strong>0 million over five years to develop capabilities in the areas ofpayer partnering, personalised healthcare, predictive science <strong>and</strong>clinical design. We are making steady progress in building theseskills both internally <strong>and</strong> through external collaborations. Examplesof our efforts in <strong>20</strong>11 include:> Payer partnering – a new payer evidence function has beenestablished to support both our Commercial <strong>and</strong> R&D organisationsin addressing the evidence needs of payers at every stage of theproduct life-cycle. A key part of this support comes from newcapabilities in analysing observational data. We have entered aunique collaboration with HealthCore, the health outcomes researchsubsidiary of Wellpoint, Inc., to conduct real world studies, designedto determine how to most effectively <strong>and</strong> economically treatdiseases. This provides access to the largest commercially insuredpopulation data environment in the US <strong>and</strong> is fully operational,supporting both development projects <strong>and</strong> marketed br<strong>and</strong>s.Building on this, in January <strong>20</strong>12, we signed a three-year collaborationagreement with IMS Health Inc., providing <strong>AstraZeneca</strong> with accessto pre-existing anonymised health records. This information willprovide a degree of insight into how medicines that are already onthe market are working in real-world settings across Europe, <strong>and</strong> willhelp inform our discovery <strong>and</strong> clinical development programmes.> Personalised healthcare – our personalised healthcare capabilityis focused on identifying patients that are most likely to benefit fromour medicines. The proportion of our development portfolio utilisingor investigating personalised healthcare approaches such as theuse of biomarkers has increased from 25% at the end of <strong>20</strong>10 toover 50%, including 10 projects that involve a companion diagnosticto target therapy. Our recently formed personalised healthcaregroup continues to support Iressa with initiatives to improve thespeed <strong>and</strong> quality of diagnostic testing, contributing to Iressa’sincrease in sales.> Predictive science – we are integrating modelling <strong>and</strong> simulationinto many different aspects of R&D. We recruited 25 external expertsfrom the global modelling <strong>and</strong> simulation community to acceleratethe development of our predictive science capability. Modelling<strong>and</strong> simulation is now used in the areas of biology, chemistry,formulation development, preclinical <strong>and</strong> clinical safety assessment,pharmacokinetic <strong>and</strong> pharmacodynamic evaluation <strong>and</strong> clinicaltrial simulation.> Clinical design – we implemented a range of innovative changesto drive consistency <strong>and</strong> excellence in the critically importantcapability of clinical trial design <strong>and</strong> interpretation. Almost 90%of our R&D teams have incorporated the changes <strong>and</strong> are startingto utilise a new design <strong>and</strong> interpretation framework.Our resourcesAt the end of <strong>20</strong>11, our R&D organisation comprised approximately11,300 people at 14 principal centres in eight countries.Our R&D transformation that began in <strong>20</strong>10 has been largelycompleted, resulting in the closure of several of our R&D facilities<strong>and</strong> a net reduction of 1,400 positions. The exit of R&D personnel<strong>and</strong> activities from the Charnwood site in the UK <strong>and</strong> the Lund sitein Sweden was completed in <strong>20</strong>11 <strong>and</strong> the facilities will be closed inearly <strong>20</strong>12. Our approach to implementing such change is outlinedin the Managing change in our organisation section on page 42.In February <strong>20</strong>12, we announced the next phase of restructuring.Further details are set out in the Our strategic priorities to <strong>20</strong>14 sectionfrom page 21.Our R&D geographic footprint includes four main small moleculefacilities in: the UK (Alderley Park <strong>and</strong> Macclesfield); Sweden (MöIndal);<strong>and</strong> the US (Waltham, Massachusetts). Other sites with a focus onresearch are in Sweden (Södertälje), Canada (Montreal, Quebec) <strong>and</strong>France (Reims). We also have a clinical development facility in Osaka,Japan. Our principal sites for biologics <strong>and</strong> vaccines are in the US(Gaithersburg, Maryl<strong>and</strong> <strong>and</strong> Mountain View, California) <strong>and</strong> in theUK (Cambridge). Our Wilmington, Delaware site in the US now focuseson late stage development across the portfolio. Finally, our strategicexpansion in Emerging Markets continues <strong>and</strong> includes the growth ofour ‘Innovation Centre China’ research facility in Shanghai, China aswell as our research facility in Bangalore, India.In <strong>20</strong>11, there was Core R&D expenditure 1 of $5.0 billion in ourR&D organisation (<strong>20</strong>10: $4.2 billion; <strong>20</strong>09: $4.3 billion). In addition,$189 million was spent on acquiring product rights (such asin-licensing) (<strong>20</strong>10: $1,017 million; <strong>20</strong>09: $764 million) <strong>and</strong> weinvested approximately $468 million on the implementation of ourR&D restructuring strategy. The allocations of <strong>20</strong>09-<strong>20</strong>11 spend byearly <strong>and</strong> late activities are presented below.R&D spend analysis <strong>20</strong>11 <strong>20</strong>10 <strong>20</strong>09iMeds (%) (Discovery <strong>and</strong> early56% 73% 70%development)GMD (%) (Late stage development) 44% 27% 30%Core R&D costs ($m) 5,033 4,219 4,3341<strong>Report</strong>ed expenditure in our R&D organisation was $5.5 billion (<strong>20</strong>10: $5.3 billion;<strong>20</strong>09: $4.4 billion).Business Review<strong>AstraZeneca</strong> <strong>Annual</strong> <strong>Report</strong> <strong>and</strong> <strong>Form</strong> <strong>20</strong>-F <strong>Information</strong> <strong>20</strong>11Delivering our strategy Research <strong>and</strong> Development 33


