Financial ReviewResults of operations – summary analysis of yearto 31 December <strong>20</strong>11 continuedRevenue increased by 1% on a <strong>Report</strong>ed basis but decreased by 2%on a CER basis. As in <strong>20</strong>10, revenue benefited from strong growth ofCrestor, Symbicort <strong>and</strong> Seroquel but was offset by lower revenues forNexium, Arimidex <strong>and</strong> Seloken/Toprol-XL. Emerging Markets salesgrowth of 10% (<strong>Report</strong>ed: 11%) <strong>and</strong> Established ROW 4% (<strong>Report</strong>ed:14%) was offset by a decline in US sales of 2% (<strong>Report</strong>ed: 2%) <strong>and</strong>Western Europe of 11% (<strong>Report</strong>ed: 7%). Further details of our salesperformance are contained in the Performance <strong>20</strong>11 sections of theTherapy Area Review from page 56 <strong>and</strong> the Geographical Reviewfrom page 77.Core gross margin of 82.2% increased 1.3 percentage points (<strong>Report</strong>ed:1.0 percentage points). The year-on-year improvement in the marginwas largely due to the impact of the intangible impairment related tolesogaberan on <strong>20</strong>10 gross margin <strong>and</strong> a $131 million benefit fromthe settlement of patent disputes with PDL Biopharma Inc. in <strong>20</strong>11.Core R&D expenditure was $5,033 million, 15% higher than last year(<strong>Report</strong>ed: 19%), driven by higher intangible impairments chargedto R&D expenditure in <strong>20</strong>11, including $285 million for olaparib <strong>and</strong>$150 million for TC-5214, <strong>and</strong> late stage project spend.Core SG&A costs of $9,918 million were 2% lower than in <strong>20</strong>10(<strong>Report</strong>ed: 1% higher). Investment in Emerging Markets <strong>and</strong> recentlylaunched br<strong>and</strong>s, as well as the impact of the US healthcare reformexcise tax were more than offset by operational efficiencies acrossEstablished Markets.Core other income of $845 million was $65 million less than the previousyear principally as a result of a higher level of disposal gains in <strong>20</strong>10.Core pre-R&D operating margin was 54.2%, up 1.0 percentage points(<strong>Report</strong>ed: 0.7 percentage points), as the higher gross margin wasonly slightly offset by lower Core other income <strong>and</strong> higher SG&A costsas a percentage of revenue.Core operating profit was $13,167 million, a decrease of 4% (<strong>Report</strong>ed:3%). Core operating margin declined by 1.2 percentage points(<strong>Report</strong>ed: 1.6 percentage points) to 39.2% as a result of the higherR&D spend <strong>and</strong> lower Core other operating income.Core EPS were $7.28, up 7% (<strong>Report</strong>ed: 9%), with the lower operatingprofit offset by a lower effective tax rate, lower net interest as well asthe benefit of a lower average number of shares outst<strong>and</strong>ing.Within Core adjustments, restructuring costs <strong>and</strong> amortisation werebroadly in line with last year’s level. Non-core intangible impairments<strong>and</strong> legal provisions were significantly reduced from <strong>20</strong>10. In <strong>20</strong>11,Core adjustments also included the profit on the sale of our dental <strong>and</strong>healthcare subsidiary Astra Tech. Excluded from Core results were:> Impairment charges of $22 million (<strong>20</strong>10: $568 million), arisingfrom impairments of assets capitalised as part of theMedImmune acquisition.> $135 million (<strong>20</strong>10: $612 million) of legal provision charges inrespect of the ongoing Seroquel product liability litigation, AverageWholesale Price litigation in the US <strong>and</strong> the Toprol-XL antitrustlitigation. In line with prior years these have been excluded fromour Core performance <strong>and</strong> full details of these matters are includedin Note 25 to the Financial Statements from page 184.> Restructuring costs totalling $1,161 million (<strong>20</strong>10: $1,<strong>20</strong>2 million),incurred as the Group continues its previously announcedefficiency programmes.> Amortisation totalling $537 million (<strong>20</strong>10: $518 million) relating toassets capitalised as part of the MedImmune acquisition <strong>and</strong> theMerck exit arrangements.> Profit on sale of our subsidiary Astra Tech of $1,483 million. On31 August, we completed the sale of Astra Tech to DENTSPLYInternational Inc. for a net cash consideration of $1,772 million.Further details of this disposal are included in Note 22 to theFinancial Statements on page 170.<strong>Report</strong>ed operating profit was up 10% at CER (<strong>Report</strong>ed: 11%) at$12,795 million, largely as a result of the impact of the profit on thedisposal of Astra Tech. <strong>Report</strong>ed EPS were $7.33, up 29% (<strong>Report</strong>ed:31%), as a result of the same factors affecting Core EPS along with theprofit recognised on the disposal of Astra Tech.Net finance expense was $428 million, against $517 million in <strong>20</strong>10,due to reduced interest payable on lower debt balances ($46 million)<strong>and</strong> a lower net pension interest expense of $55 million principally dueto increased pension assets held by our defined benefit schemes.The <strong>20</strong>11 taxation charge of $2,351 million (<strong>20</strong>10: $2,896 million)consists of a current tax charge of $2,578 million (<strong>20</strong>10: $3,435 million)<strong>and</strong> a credit arising from movements on deferred tax of $227 million(<strong>20</strong>10: $539 million).The current year tax charge includes a prior period current tax creditof $102 million (<strong>20</strong>10: charge of $370 million). The reported effectivetax rate for the year was 19.0% (<strong>20</strong>10: 26.4%). The reported effectivetax rate has benefited from the non-taxable gain on the disposal ofAstra Tech <strong>and</strong> an adjustment in respect of prior periods following theannouncement in March <strong>20</strong>11 that HM Revenue & Customs in the UK<strong>and</strong> the US Internal Revenue Service (IRS) agreed the terms of anAdvance Pricing Agreement regarding transfer pricing arrangementsfor <strong>AstraZeneca</strong>’s US business for the period from <strong>20</strong>02 to the end of<strong>20</strong>14 <strong>and</strong> a related valuation matter as detailed more fully in Note 4 tothe Financial Statements from page 152. Excluding these benefits, theeffective tax rate for the year was 26.4% on a reported basis. This26.4% tax rate is applied to the taxable Core adjustments to operatingprofit, resulting in a Core effective tax rate for the year of 22.0%including the benefit of the Advanced Pricing Agreement <strong>and</strong> relatedvaluation matter settlement. A description of our tax exposures is setout in Note 25 to the Financial Statements on page 189.Total comprehensive income for the year increased by $1,364 millionfrom <strong>20</strong>10 to $9,470 million. This was driven by the increase in profitfor the year of $1,935 million, offset by a decrease of $571 million inother comprehensive income, principally due to $741 million ofactuarial losses on our defined benefit schemes arising from lowerdiscount rates being applied to our long-term pension obligationsreflecting external market conditions.Cash flow <strong>and</strong> liquidity – <strong>20</strong>11All data in this section is on a <strong>Report</strong>ed basis.Cash generated from operating activities was $7,821 million in the yearto 31 December <strong>20</strong>11, compared with $10,680 million in <strong>20</strong>10. Thedecrease of $2,859 million is primarily driven by higher tax paymentsmade this year, including a net amount of $1.1 billion in relation to theAdvance Pricing Agreement between the UK <strong>and</strong> US governments’ taxauthorities <strong>and</strong> the settlement of a related valuation matter, an increasein trade <strong>and</strong> other receivables <strong>and</strong> higher contributions made to our UKdefined benefit pension fund.Investment cash inflows of $577 million include the sale of Astra Tech($1,772 million). Cash outflows on the purchase of tangible fixed assetsamounted to $839 million in the year, in line with <strong>20</strong>10. Further detailsof the Astra Tech disposal are included in Note 22 to the FinancialStatements from page 170.Net cash distributions to shareholders increased from $5,471 millionin <strong>20</strong>10 to $9,370 million in <strong>20</strong>11 through dividend payments of$3,764 million <strong>and</strong> net share repurchases of $5,606 million, asignificant increase on <strong>20</strong>10 repurchases of $2,110 million. Thisreflects the Board’s <strong>20</strong>10 stated objective of $4 billion sharerepurchases in <strong>20</strong>11, with the target increased in <strong>20</strong>11 followingthe Board’s decision to use the net proceeds from the Astra Techsale to increase share repurchases.86 Financial Review<strong>AstraZeneca</strong> <strong>Annual</strong> <strong>Report</strong> <strong>and</strong> <strong>Form</strong> <strong>20</strong>-F <strong>Information</strong> <strong>20</strong>11
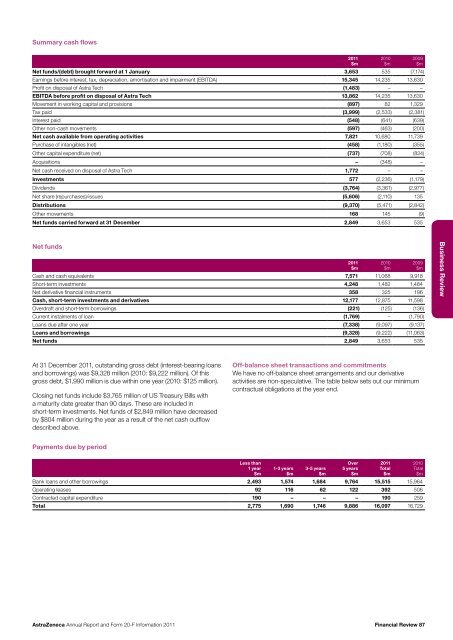
Summary cash flowsNet funds/(debt) brought forward at 1 January 3,653 535 (7,174)Earnings before interest, tax, depreciation, amortisation <strong>and</strong> impairment (EBITDA) 15,345 14,235 13,630Profit on disposal of Astra Tech (1,483) – –EBITDA before profit on disposal of Astra Tech 13,862 14,235 13,630Movement in working capital <strong>and</strong> provisions (897) 82 1,329Tax paid (3,999) (2,533) (2,381)Interest paid (548) (641) (639)Other non-cash movements (597) (463) (<strong>20</strong>0)Net cash available from operating activities 7,821 10,680 11,739Purchase of intangibles (net) (458) (1,180) (355)Other capital expenditure (net) (737) (708) (824)Acquisitions – (348) –Net cash received on disposal of Astra Tech 1,772 – –Investments 577 (2,236) (1,179)Dividends (3,764) (3,361) (2,977)Net share (repurchases)/issues (5,606) (2,110) 135Distributions (9,370) (5,471) (2,842)Other movements 168 145 (9)Net funds carried forward at 31 December 2,849 3,653 535<strong>20</strong>11$m<strong>20</strong>10$m<strong>20</strong>09$mNet fundsCash <strong>and</strong> cash equivalents 7,571 11,068 9,918Short-term investments 4,248 1,482 1,484Net derivative financial instruments 358 325 196Cash, short-term investments <strong>and</strong> derivatives 12,177 12,875 11,598Overdraft <strong>and</strong> short-term borrowings (221) (125) (136)Current instalments of loan (1,769) – (1,790)Loans due after one year (7,338) (9,097) (9,137)Loans <strong>and</strong> borrowings (9,328) (9,222) (11,063)Net funds 2,849 3,653 535<strong>20</strong>11$m<strong>20</strong>10$m<strong>20</strong>09$mBusiness ReviewAt 31 December <strong>20</strong>11, outst<strong>and</strong>ing gross debt (interest-bearing loans<strong>and</strong> borrowings) was $9,328 million (<strong>20</strong>10: $9,222 million). Of thisgross debt, $1,990 million is due within one year (<strong>20</strong>10: $125 million).Closing net funds include $3,765 million of US Treasury Bills witha maturity date greater than 90 days. These are included inshort-term investments. Net funds of $2,849 million have decreasedby $804 million during the year as a result of the net cash outflowdescribed above.Off-balance sheet transactions <strong>and</strong> commitmentsWe have no off-balance sheet arrangements <strong>and</strong> our derivativeactivities are non-speculative. The table below sets out our minimumcontractual obligations at the year end.Payments due by periodLess than1 year$m1-3 years$m3-5 years$mBank loans <strong>and</strong> other borrowings 2,493 1,574 1,684 9,764 15,515 15,964Operating leases 92 116 62 122 392 506Contracted capital expenditure 190 – – – 190 259Total 2,775 1,690 1,746 9,886 16,097 16,729Over5 years$m<strong>20</strong>11Total$m<strong>20</strong>10Total$m<strong>AstraZeneca</strong> <strong>Annual</strong> <strong>Report</strong> <strong>and</strong> <strong>Form</strong> <strong>20</strong>-F <strong>Information</strong> <strong>20</strong>11Financial Review 87