Financial Statements15 Financial instruments continuedFair values of financial assets <strong>and</strong> financial liabilitiesSet out below is a comparison by category of carrying values <strong>and</strong> fair values of all the Group’s financial assets <strong>and</strong> financial liabilities at31 December <strong>20</strong>11, 31 December <strong>20</strong>10 <strong>and</strong> 31 December <strong>20</strong>09. None of the financial assets or financial liabilities have been reclassifiedduring the year.Instruments in afair value hedgerelationship 1$mInstrumentsdesignatedat fair value 2$mOther financialinstrumentsat fair value 3$mAvailablefor sale$mHeld fortrading$mAmortisedcost$m<strong>20</strong>11Cash <strong>and</strong> cash equivalents – – – – – 7,571 7,571 7,571Overdrafts – – – – – (137) (137) (137)Loans due within one year (770) – – – – (1,083) (1,853) (1,891)Loans due after more than one year (899) (1,221) – – – (5,218) 4 (7,338) (8,765)Derivative financial instruments 173 189 (4) – – – 358 358Other investments – – – 497 25 3,927 4,449 4,449Other financial assets – – – – – 7,867 7,867 7,867Other financial liabilities – – – – – (9,360) (9,360) (9,360)<strong>20</strong>10Cash <strong>and</strong> cash equivalents – – – – – 11,068 11,068 11,068Overdrafts – – – – – (87) (87) (87)Loans due within one year – – – – – (38) (38) (38)Loans due after more than one year (1,659) (1,196) – – – (6,242) 4 (9,097) (10,022)Derivative financial instruments 164 160 1 – – – 325 325Other investments – – – 566 <strong>20</strong> 1,107 1,693 1,693Other financial assets – – 25 – – 6,893 6,918 6,918Other financial liabilities – – (50) – – (8,963) (9,013) (9,013)<strong>20</strong>09Cash <strong>and</strong> cash equivalents – – – – – 9,918 9,918 9,918Overdrafts – – – – – (90) (90) (90)Loans due within one year – – – – – (1,836) (1,836) (1,867)Loans due after more than one year (1,629) (1,167) – – – (6,341) 4 (9,137) (9,832)Derivative financial instruments 135 127 (66) – – – 196 196Other investments – – – 184 18 1,466 1,668 1,668Other financial assets – – – – – 6,979 6,979 6,979Other financial liabilities – – – – – (8,872) (8,872) (8,872)Totalcarryingvalue$mFairvalue$m1Includes borrowings <strong>and</strong> derivatives designated as hedged items in fair value hedge relationships with respect to interest rate risk.2Includes borrowings designated at fair value through profit or loss, <strong>and</strong> related derivatives.3Includes derivatives not designated in hedge relationships or related to financial instruments designated at fair value through profit or loss, <strong>and</strong> contingent consideration arising on businesscombinations (Note 22).4Includes borrowings designated as hedges of net investments in foreign operations of $1,505m (<strong>20</strong>10: $1,528m; <strong>20</strong>09: $1,630m) held at amortised cost. The fair value of these borrowings was$1,752m at 31 December <strong>20</strong>11 (<strong>20</strong>10: $1,687m; <strong>20</strong>09: $1,747m).Other financial assets represent trade <strong>and</strong> other receivables (Note 12) excluding prepayments <strong>and</strong> accrued income. Other financial liabilitiesrepresent trade <strong>and</strong> other payables (Note 16) excluding deferred income.A gain of $4m was made during the year on the fair value of bonds designated at fair value through profit <strong>and</strong> loss, due to increased credit risk.A gain of $44m has been made on these bonds since designation due to increased credit risk. Changes in credit risk had no material effect onany other financial assets <strong>and</strong> liabilities recognised at fair value in the Group’s Financial Statements. The change in fair value attributable to changesin credit risk is calculated as the change in fair value not attributable to market risk. The amount payable at maturity on bonds designated at fairvalue through profit or loss is $1,037m.The methods <strong>and</strong> assumptions used to estimate the fair values of financial instruments together with their carrying values are as follows:> > Cash <strong>and</strong> overdrafts – held on the consolidated statement of financial position at amortised costs. Fair value approximates to carrying value.> > Loans due within one year <strong>and</strong> after more than one year – the fair value of fixed-rate publicly traded debt is based on year end quoted marketprices; the fair value of floating rate debt is nominal value, as mark to market differences would be minimal given the frequency of resets.The carrying value of loans designated at fair value through profit or loss is the fair value. For loans designated in a fair value hedge relationship,carrying value is initially measured at fair value <strong>and</strong> remeasured for fair value changes in respect of the hedged risk at each reporting date.All other loans are held at amortised cost.> > Derivative financial instruments – consists of interest rate swaps (included in instruments designated at fair value if related to debt designatedat fair value or instruments in a fair value hedge relationship if formally designated as in a fair value hedge relationship) <strong>and</strong> forward foreignexchange contracts (included in other financial instruments at fair value). All derivatives are held at fair value.––Interest rate swaps – the fair value is estimated using appropriate zero coupon curve valuation techniques to discount future contractualcash flows based on rates current at year end.––Forward foreign exchange contracts – the majority of contracts for existing transactions had maturities of less than one month from year end.The fair value of forward foreign exchange contracts is estimated by discounting the future contractual cash flows using appropriate yieldcurves based on market forward foreign exchange rates at the year end.> > Other investments – held on the consolidated statement of financial position at fair value. These include equity securities held on theconsolidated statement of financial position as other investments (Note 10). The fair value of listed investments is based on year end quotedmarket prices. Unlisted investments are held at cost which approximates to fair value.> > Other financial assets <strong>and</strong> other financial liabilities – with the exception of contingent consideration which is held at fair value (see Note 22),other financial assets <strong>and</strong> liabilities are held on the consolidated statement of financial position at amortised costs with carrying value beinga reasonable approximation of fair value.162 Financial Statements<strong>AstraZeneca</strong> <strong>Annual</strong> <strong>Report</strong> <strong>and</strong> <strong>Form</strong> <strong>20</strong>-F <strong>Information</strong> <strong>20</strong>11
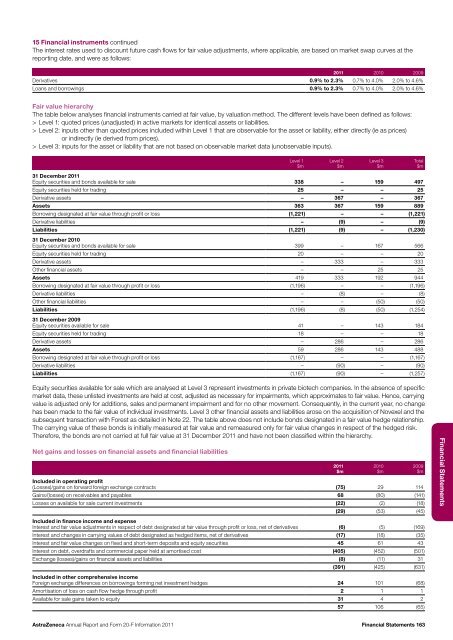
15 Financial instruments continuedThe interest rates used to discount future cash flows for fair value adjustments, where applicable, are based on market swap curves at thereporting date, <strong>and</strong> were as follows:<strong>20</strong>11 <strong>20</strong>10 <strong>20</strong>09Derivatives 0.9% to 2.3% 0.7% to 4.0% 2.0% to 4.6%Loans <strong>and</strong> borrowings 0.9% to 2.3% 0.7% to 4.0% 2.0% to 4.6%Fair value hierarchyThe table below analyses financial instruments carried at fair value, by valuation method. The different levels have been defined as follows:> > Level 1: quoted prices (unadjusted) in active markets for identical assets or liabilities.> > Level 2: inputs other than quoted prices included within Level 1 that are observable for the asset or liability, either directly (ie as prices)or indirectly (ie derived from prices).> > Level 3: inputs for the asset or liability that are not based on observable market data (unobservable inputs).31 December <strong>20</strong>11Equity securities <strong>and</strong> bonds available for sale 338 – 159 497Equity securities held for trading 25 – – 25Derivative assets – 367 – 367Assets 363 367 159 889Borrowing designated at fair value through profit or loss (1,221) – – (1,221)Derivative liabilities – (9) – (9)Liabilities (1,221) (9) – (1,230)31 December <strong>20</strong>10Equity securities <strong>and</strong> bonds available for sale 399 – 167 566Equity securities held for trading <strong>20</strong> – – <strong>20</strong>Derivative assets – 333 – 333Other financial assets – – 25 25Assets 419 333 192 944Borrowing designated at fair value through profit or loss (1,196) – – (1,196)Derivative liabilities – (8) – (8)Other financial liabilities – – (50) (50)Liabilities (1,196) (8) (50) (1,254)31 December <strong>20</strong>09Equity securities available for sale 41 – 143 184Equity securities held for trading 18 – – 18Derivative assets – 286 – 286Assets 59 286 143 488Borrowing designated at fair value through profit or loss (1,167) – – (1,167)Derivative liabilities – (90) – (90)Liabilities (1,167) (90) – (1,257)Level 1$mLevel 2$mLevel 3$mTotal$mEquity securities available for sale which are analysed at Level 3 represent investments in private biotech companies. In the absence of specificmarket data, these unlisted investments are held at cost, adjusted as necessary for impairments, which approximates to fair value. Hence, carryingvalue is adjusted only for additions, sales <strong>and</strong> permanent impairment <strong>and</strong> for no other movement. Consequently, in the current year, no changehas been made to the fair value of individual investments. Level 3 other financial assets <strong>and</strong> liabilities arose on the acquisition of Novexel <strong>and</strong> thesubsequent transaction with Forest as detailed in Note 22. The table above does not include bonds designated in a fair value hedge relationship.The carrying value of these bonds is initially measured at fair value <strong>and</strong> remeasured only for fair value changes in respect of the hedged risk.Therefore, the bonds are not carried at full fair value at 31 December <strong>20</strong>11 <strong>and</strong> have not been classified within the hierarchy.Net gains <strong>and</strong> losses on financial assets <strong>and</strong> financial liabilitiesIncluded in operating profit(Losses)/gains on forward foreign exchange contracts (75) 29 114Gains/(losses) on receivables <strong>and</strong> payables 68 (80) (141)Losses on available for sale current investments (22) (2) (18)(29) (53) (45)Included in finance income <strong>and</strong> expenseInterest <strong>and</strong> fair value adjustments in respect of debt designated at fair value through profit or loss, net of derivatives (6) (5) (169)Interest <strong>and</strong> changes in carrying values of debt designated as hedged items, net of derivatives (17) (18) (35)Interest <strong>and</strong> fair value changes on fixed <strong>and</strong> short-term deposits <strong>and</strong> equity securities 45 61 43Interest on debt, overdrafts <strong>and</strong> commercial paper held at amortised cost (405) (452) (501)Exchange (losses)/gains on financial assets <strong>and</strong> liabilities (8) (11) 31(391) (425) (631)Included in other comprehensive incomeForeign exchange differences on borrowings forming net investment hedges 24 101 (68)Amortisation of loss on cash flow hedge through profit 2 1 1Available for sale gains taken to equity 31 4 257 106 (65)<strong>20</strong>11$m<strong>20</strong>10$m<strong>20</strong>09$mFinancial Statements<strong>AstraZeneca</strong> <strong>Annual</strong> <strong>Report</strong> <strong>and</strong> <strong>Form</strong> <strong>20</strong>-F <strong>Information</strong> <strong>20</strong>11 Financial Statements 163