

Evaluation of the Ticket to Work Program, Implementation ...
Evaluation of the Ticket to Work Program, Implementation ...
Evaluation of the Ticket to Work Program, Implementation ...

You also want an ePaper? Increase the reach of your titles
YUMPU automatically turns print PDFs into web optimized ePapers that Google loves.
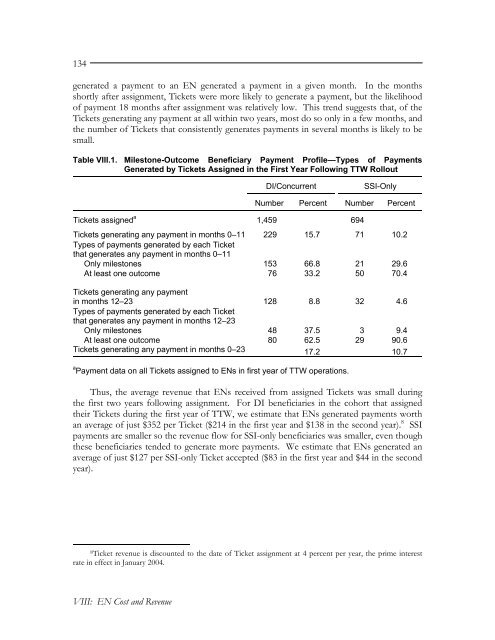
134generated a payment <strong>to</strong> an EN generated a payment in a given month. In <strong>the</strong> monthsshortly after assignment, <strong>Ticket</strong>s were more likely <strong>to</strong> generate a payment, but <strong>the</strong> likelihood<strong>of</strong> payment 18 months after assignment was relatively low. This trend suggests that, <strong>of</strong> <strong>the</strong><strong>Ticket</strong>s generating any payment at all within two years, most do so only in a few months, and<strong>the</strong> number <strong>of</strong> <strong>Ticket</strong>s that consistently generates payments in several months is likely <strong>to</strong> besmall.Table VIII.1. Miles<strong>to</strong>ne-Outcome Beneficiary Payment Pr<strong>of</strong>ile—Types <strong>of</strong> PaymentsGenerated by <strong>Ticket</strong>s Assigned in <strong>the</strong> First Year Following TTW RolloutDI/ConcurrentSSI-OnlyNumber Percent Number Percent<strong>Ticket</strong>s assigned a 1,459 694<strong>Ticket</strong>s generating any payment in months 0–11 229 15.7 71 10.2Types <strong>of</strong> payments generated by each <strong>Ticket</strong>that generates any payment in months 0–11Only miles<strong>to</strong>nes 153 66.8 21 29.6At least one outcome 76 33.2 50 70.4<strong>Ticket</strong>s generating any paymentin months 12–23 128 8.8 32 4.6Types <strong>of</strong> payments generated by each <strong>Ticket</strong>that generates any payment in months 12–23Only miles<strong>to</strong>nes 48 37.5 3 9.4At least one outcome 80 62.5 29 90.6<strong>Ticket</strong>s generating any payment in months 0–23 17.2 10.7a Payment data on all <strong>Ticket</strong>s assigned <strong>to</strong> ENs in first year <strong>of</strong> TTW operations.Thus, <strong>the</strong> average revenue that ENs received from assigned <strong>Ticket</strong>s was small during<strong>the</strong> first two years following assignment. For DI beneficiaries in <strong>the</strong> cohort that assigned<strong>the</strong>ir <strong>Ticket</strong>s during <strong>the</strong> first year <strong>of</strong> TTW, we estimate that ENs generated payments worthan average <strong>of</strong> just $352 per <strong>Ticket</strong> ($214 in <strong>the</strong> first year and $138 in <strong>the</strong> second year). 8 SSIpayments are smaller so <strong>the</strong> revenue flow for SSI-only beneficiaries was smaller, even though<strong>the</strong>se beneficiaries tended <strong>to</strong> generate more payments. We estimate that ENs generated anaverage <strong>of</strong> just $127 per SSI-only <strong>Ticket</strong> accepted ($83 in <strong>the</strong> first year and $44 in <strong>the</strong> secondyear).8 <strong>Ticket</strong> revenue is discounted <strong>to</strong> <strong>the</strong> date <strong>of</strong> <strong>Ticket</strong> assignment at 4 percent per year, <strong>the</strong> prime interestrate in effect in January 2004.VIII: EN Cost and Revenue


