

Evaluation of the Ticket to Work Program, Implementation ...
Evaluation of the Ticket to Work Program, Implementation ...
Evaluation of the Ticket to Work Program, Implementation ...

Create successful ePaper yourself
Turn your PDF publications into a flip-book with our unique Google optimized e-Paper software.
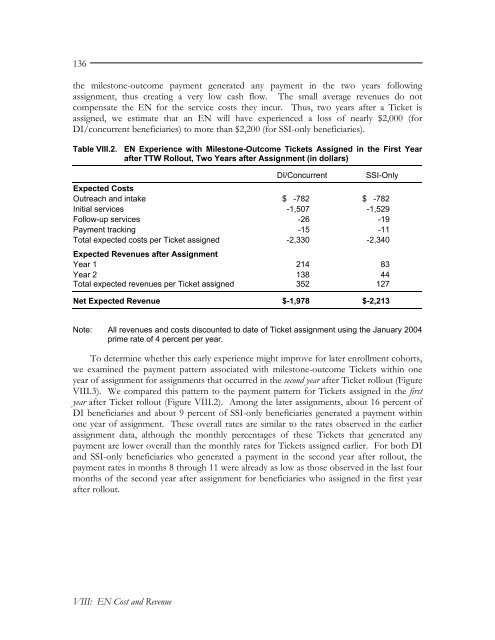
136<strong>the</strong> miles<strong>to</strong>ne-outcome payment generated any payment in <strong>the</strong> two years followingassignment, thus creating a very low cash flow. The small average revenues do notcompensate <strong>the</strong> EN for <strong>the</strong> service costs <strong>the</strong>y incur. Thus, two years after a <strong>Ticket</strong> isassigned, we estimate that an EN will have experienced a loss <strong>of</strong> nearly $2,000 (forDI/concurrent beneficiaries) <strong>to</strong> more than $2,200 (for SSI-only beneficiaries).Table VIII.2. EN Experience with Miles<strong>to</strong>ne-Outcome <strong>Ticket</strong>s Assigned in <strong>the</strong> First Yearafter TTW Rollout, Two Years after Assignment (in dollars)DI/ConcurrentSSI-OnlyExpected CostsOutreach and intake $ -782 $ -782Initial services -1,507 -1,529Follow-up services -26 -19Payment tracking -15 -11Total expected costs per <strong>Ticket</strong> assigned -2,330 -2,340Expected Revenues after AssignmentYear 1 214 83Year 2 138 44Total expected revenues per <strong>Ticket</strong> assigned 352 127Net Expected Revenue $-1,978 $-2,213Note: All revenues and costs discounted <strong>to</strong> date <strong>of</strong> <strong>Ticket</strong> assignment using <strong>the</strong> January 2004prime rate <strong>of</strong> 4 percent per year.To determine whe<strong>the</strong>r this early experience might improve for later enrollment cohorts,we examined <strong>the</strong> payment pattern associated with miles<strong>to</strong>ne-outcome <strong>Ticket</strong>s within oneyear <strong>of</strong> assignment for assignments that occurred in <strong>the</strong> second year after <strong>Ticket</strong> rollout (FigureVIII.3). We compared this pattern <strong>to</strong> <strong>the</strong> payment pattern for <strong>Ticket</strong>s assigned in <strong>the</strong> firstyear after <strong>Ticket</strong> rollout (Figure VIII.2). Among <strong>the</strong> later assignments, about 16 percent <strong>of</strong>DI beneficiaries and about 9 percent <strong>of</strong> SSI-only beneficiaries generated a payment withinone year <strong>of</strong> assignment. These overall rates are similar <strong>to</strong> <strong>the</strong> rates observed in <strong>the</strong> earlierassignment data, although <strong>the</strong> monthly percentages <strong>of</strong> <strong>the</strong>se <strong>Ticket</strong>s that generated anypayment are lower overall than <strong>the</strong> monthly rates for <strong>Ticket</strong>s assigned earlier. For both DIand SSI-only beneficiaries who generated a payment in <strong>the</strong> second year after rollout, <strong>the</strong>payment rates in months 8 through 11 were already as low as those observed in <strong>the</strong> last fourmonths <strong>of</strong> <strong>the</strong> second year after assignment for beneficiaries who assigned in <strong>the</strong> first yearafter rollout.VIII: EN Cost and Revenue


