

Evaluation of the Ticket to Work Program, Implementation ...
Evaluation of the Ticket to Work Program, Implementation ...
Evaluation of the Ticket to Work Program, Implementation ...

Create successful ePaper yourself
Turn your PDF publications into a flip-book with our unique Google optimized e-Paper software.
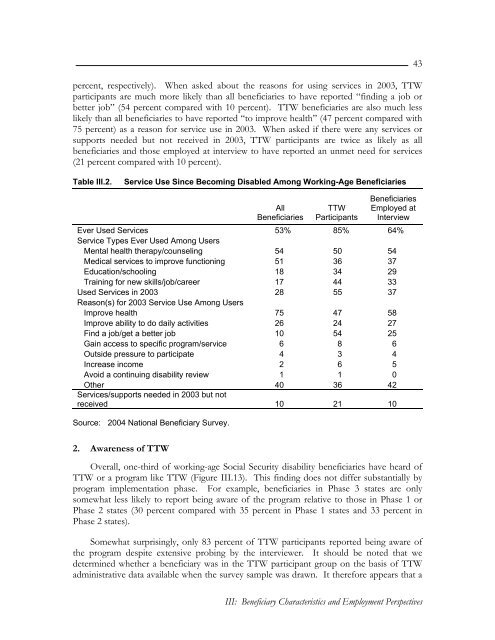
percent, respectively). When asked about <strong>the</strong> reasons for using services in 2003, TTWparticipants are much more likely than all beneficiaries <strong>to</strong> have reported “finding a job orbetter job” (54 percent compared with 10 percent). TTW beneficiaries are also much lesslikely than all beneficiaries <strong>to</strong> have reported “<strong>to</strong> improve health” (47 percent compared with75 percent) as a reason for service use in 2003. When asked if <strong>the</strong>re were any services orsupports needed but not received in 2003, TTW participants are twice as likely as allbeneficiaries and those employed at interview <strong>to</strong> have reported an unmet need for services(21 percent compared with 10 percent).43Table III.2.Service Use Since Becoming Disabled Among <strong>Work</strong>ing-Age BeneficiariesAllBeneficiariesTTWParticipantsBeneficiariesEmployed atInterviewEver Used Services 53% 85% 64%Service Types Ever Used Among UsersMental health <strong>the</strong>rapy/counseling 54 50 54Medical services <strong>to</strong> improve functioning 51 36 37Education/schooling 18 34 29Training for new skills/job/career 17 44 33Used Services in 2003 28 55 37Reason(s) for 2003 Service Use Among UsersImprove health 75 47 58Improve ability <strong>to</strong> do daily activities 26 24 27Find a job/get a better job 10 54 25Gain access <strong>to</strong> specific program/service 6 8 6Outside pressure <strong>to</strong> participate 4 3 4Increase income 2 6 5Avoid a continuing disability review 1 1 0O<strong>the</strong>r 40 36 42Services/supports needed in 2003 but notreceived 10 21 10Source: 2004 National Beneficiary Survey.2. Awareness <strong>of</strong> TTWOverall, one-third <strong>of</strong> working-age Social Security disability beneficiaries have heard <strong>of</strong>TTW or a program like TTW (Figure III.13). This finding does not differ substantially byprogram implementation phase. For example, beneficiaries in Phase 3 states are onlysomewhat less likely <strong>to</strong> report being aware <strong>of</strong> <strong>the</strong> program relative <strong>to</strong> those in Phase 1 orPhase 2 states (30 percent compared with 35 percent in Phase 1 states and 33 percent inPhase 2 states).Somewhat surprisingly, only 83 percent <strong>of</strong> TTW participants reported being aware <strong>of</strong><strong>the</strong> program despite extensive probing by <strong>the</strong> interviewer. It should be noted that wedetermined whe<strong>the</strong>r a beneficiary was in <strong>the</strong> TTW participant group on <strong>the</strong> basis <strong>of</strong> TTWadministrative data available when <strong>the</strong> survey sample was drawn. It <strong>the</strong>refore appears that aIII: Beneficiary Characteristics and Employment Perspectives


