- Page 3 and 4: A CKNOWLEDGMENTSThe Ticket To Work
- Page 8 and 9: viiiChapterVI(CONTINUED)PageF. SUMM
- Page 10 and 11: xChapterPageAPPENDIX A: TICKET TO W
- Page 12 and 13: xiiTableVIII.3IX.1IX.2IX.3IX.4IX.5I
- Page 14 and 15: xivFigureIII.5III.6III.7III.8III.9P
- Page 16 and 17: xviIX.3EARNINGS OF BENEFICIARIES WI
- Page 18 and 19: xviiiMIENBSNPRMOAGPABSSPSUSGASSASSI
- Page 20 and 21: xxIn Phase 3, which began in Novemb
- Page 22 and 23: xxiigroups of beneficiaries that Co
- Page 24 and 25: xxivimprove TTW, therefore, is to f
- Page 26 and 27: 2of disability beneficiaries, and i
- Page 28 and 29: 4country. Phase 2 began in November
- Page 30 and 31: Page Is Intentionally Left Blank to
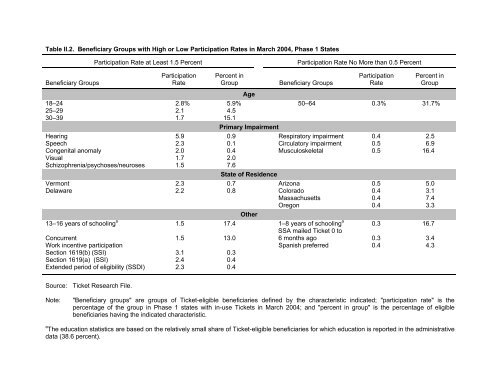
- Page 32 and 33: 8Only a few beneficiary characteris
- Page 34 and 35: 10Figure II.2.Participation Rate, b
- Page 36 and 37: 12Figure II.4.First Assignments at
- Page 38 and 39: 14before Ticket, it is perhaps surp
- Page 40 and 41: 16was selected for Phase 3. This ma
- Page 42 and 43: 18All of the statistics in this sec
- Page 46 and 47: 22In all Phase 1 and Phase 2 states
- Page 48 and 49: 24Figure II.8. Ticket Participation
- Page 50 and 51: 26Adjustments for all other charact
- Page 52 and 53: 28In general, provider and payment
- Page 54 and 55: 30next report, we will conduct more
- Page 56 and 57: 32Figure III.2.Living Arrangements
- Page 58 and 59: 34• Less likely to have reported
- Page 60 and 61: 36Figure III.7.Prevalence of Diffic
- Page 62 and 63: 38are more likely than all benefici
- Page 64 and 65: 40Table III.1.Income and Program Pa
- Page 66 and 67: 42coverage through their own employ
- Page 68 and 69: 44sizable percentage of TTW partici
- Page 70 and 71: 46Overall, 9 percent of working-age
- Page 72 and 73: 48leave the rolls in the next year,
- Page 74 and 75: 50next year and in the next five ye
- Page 76 and 77: 52in their characteristics, levels
- Page 78 and 79: 54percentage points to 3.7 percent.
- Page 80 and 81: 56Figure IV.2. Phase 1 Ticket Recip
- Page 82 and 83: 58situation described in the preced
- Page 84 and 85: 60the end of the follow-up period w
- Page 86 and 87: 62Figure IV.6. Average Monthly Bene
- Page 88 and 89: Page Is Intentionally Left Blank to
- Page 90 and 91: 66ENs were reluctant to expand serv
- Page 92 and 93: 68As of July 2004, there were about
- Page 94 and 95:
70But most EN representatives saw T
- Page 96 and 97:
72Figure V.2. Number of EN Terminat
- Page 98 and 99:
74received a total of just about $2
- Page 100 and 101:
76Relatively few ENs have received
- Page 102 and 103:
78According to their representative
- Page 104 and 105:
80Five EN officials recognized that
- Page 106 and 107:
82This was particularly true for so
- Page 108 and 109:
84• Another EN representative fou
- Page 110 and 111:
86• A third EN received 50 calls
- Page 112 and 113:
88resolve administrative issues suc
- Page 114 and 115:
90• Raise payments for SSI benefi
- Page 116 and 117:
92Finally, the real and perceived w
- Page 118 and 119:
94efforts to obtain Ticket assignme
- Page 120 and 121:
96SSA payments to SVRAs under the T
- Page 122 and 123:
98Figure VI.3. Total SSA Payments t
- Page 124 and 125:
100assigning their Tickets to ENs (
- Page 126 and 127:
102Table VI.1. SVRA Ticket Assignme
- Page 128 and 129:
104case, the counselor selects the
- Page 130 and 131:
106• Most of the agreements requi
- Page 132 and 133:
108needs of SSA beneficiaries and,
- Page 134 and 135:
110to the SVRA under the traditiona
- Page 136 and 137:
112Tickets each month from November
- Page 138 and 139:
114about submitting virtually ident
- Page 140 and 141:
116To make EN recruiting efforts mo
- Page 142 and 143:
118E. EN ENROLLMENTThe Program Mana
- Page 144 and 145:
120beneficiaries who have achieved
- Page 146 and 147:
122quarterly basis if they have rec
- Page 148 and 149:
124SSA’s approval of systems spec
- Page 150 and 151:
Page Is Intentionally Left Blank to
- Page 152 and 153:
128have accepted. But even at that
- Page 154 and 155:
130For beneficiaries who express an
- Page 156 and 157:
132rehabilitation counselors (Burea
- Page 158 and 159:
134generated a payment to an EN gen
- Page 160 and 161:
136the milestone-outcome payment ge
- Page 162 and 163:
138system is used so infrequently t
- Page 164 and 165:
140One option is for ENs to try to
- Page 166 and 167:
142approximations. Our planned anal
- Page 168 and 169:
144Figure IX.1. Ticket-Eligible Ben
- Page 170 and 171:
146Table IX.2.TTW Participation Rat
- Page 172 and 173:
148Figure IX.3. Earnings of Benefic
- Page 174 and 175:
150Compared with other beneficiarie
- Page 176 and 177:
152Like all other beneficiaries who
- Page 178 and 179:
This kind of mixed success in the e
- Page 180 and 181:
C. SVRA PARTICIPATION REMAINS STRON
- Page 182 and 183:
serving beneficiaries who are simil
- Page 184 and 185:
observe changes in their employment
- Page 186 and 187:
Page Is Intentionally Left Blank to
- Page 188 and 189:
Mashaw, Jerry L., and Virginia P. R
- Page 190 and 191:
A-2Table A.1 (continued)Time Period
- Page 192 and 193:
Page Is Intentionally Left Blank to
- Page 194 and 195:
Table B.1. DefinitionsB-2Variable D
- Page 196 and 197:
Table B.1 (continued)B-4Variable De
- Page 198 and 199:
Table B.1 (continued)Variable Defin
- Page 200 and 201:
B-8Table B.3. Participation Rate by
- Page 202 and 203:
B-10C. PARTICIPATION RATES BY BENEF
- Page 204 and 205:
Table B.6. Participation Rates by C
- Page 206 and 207:
Table B.6 (continued)Group Definiti
- Page 208 and 209:
Table B.6 (continued)B-16Group Defi
- Page 210 and 211:
Page Is Intentionally Left Blank to
- Page 212 and 213:
C-2survey. Whenever possible, the i
- Page 214 and 215:
C-4given the large number of benefi
- Page 216 and 217:
C-6• Young SSI recipients who are
- Page 218 and 219:
C-8beneficiary may have had with EN
- Page 220 and 221:
C-10Table C.2. Overview of the Nati
- Page 222 and 223:
C-12Sample completes (n=1,178) and
- Page 224 and 225:
C.14Table C.3 (continued)AllIntervi
- Page 226 and 227:
C.16Table C.5. Final Weighted and U
- Page 228 and 229:
C.18Table C.7. Sociodemographic Cha
- Page 230 and 231:
C.20Table C.9. Health Status (Figur
- Page 232 and 233:
C.22Table C.11. Program Participati
- Page 234 and 235:
C.24Table C.14. Awareness of TTW (F
- Page 236 and 237:
C.26Table C.16. Employment Expectat
- Page 238 and 239:
D-2Table D.1. Selected Characterist
- Page 240:
D-4information from two pretest int


