Evaluation of the Ticket to Work Program, Implementation ...
Evaluation of the Ticket to Work Program, Implementation ...
Evaluation of the Ticket to Work Program, Implementation ...
You also want an ePaper? Increase the reach of your titles
YUMPU automatically turns print PDFs into web optimized ePapers that Google loves.
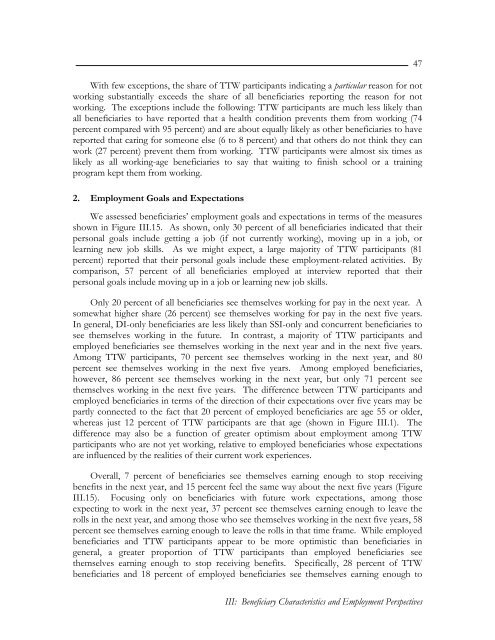
With few exceptions, <strong>the</strong> share <strong>of</strong> TTW participants indicating a particular reason for notworking substantially exceeds <strong>the</strong> share <strong>of</strong> all beneficiaries reporting <strong>the</strong> reason for notworking. The exceptions include <strong>the</strong> following: TTW participants are much less likely thanall beneficiaries <strong>to</strong> have reported that a health condition prevents <strong>the</strong>m from working (74percent compared with 95 percent) and are about equally likely as o<strong>the</strong>r beneficiaries <strong>to</strong> havereported that caring for someone else (6 <strong>to</strong> 8 percent) and that o<strong>the</strong>rs do not think <strong>the</strong>y canwork (27 percent) prevent <strong>the</strong>m from working. TTW participants were almost six times aslikely as all working-age beneficiaries <strong>to</strong> say that waiting <strong>to</strong> finish school or a trainingprogram kept <strong>the</strong>m from working.2. Employment Goals and ExpectationsWe assessed beneficiaries’ employment goals and expectations in terms <strong>of</strong> <strong>the</strong> measuresshown in Figure III.15. As shown, only 30 percent <strong>of</strong> all beneficiaries indicated that <strong>the</strong>irpersonal goals include getting a job (if not currently working), moving up in a job, orlearning new job skills. As we might expect, a large majority <strong>of</strong> TTW participants (81percent) reported that <strong>the</strong>ir personal goals include <strong>the</strong>se employment-related activities. Bycomparison, 57 percent <strong>of</strong> all beneficiaries employed at interview reported that <strong>the</strong>irpersonal goals include moving up in a job or learning new job skills.Only 20 percent <strong>of</strong> all beneficiaries see <strong>the</strong>mselves working for pay in <strong>the</strong> next year. Asomewhat higher share (26 percent) see <strong>the</strong>mselves working for pay in <strong>the</strong> next five years.In general, DI-only beneficiaries are less likely than SSI-only and concurrent beneficiaries <strong>to</strong>see <strong>the</strong>mselves working in <strong>the</strong> future. In contrast, a majority <strong>of</strong> TTW participants andemployed beneficiaries see <strong>the</strong>mselves working in <strong>the</strong> next year and in <strong>the</strong> next five years.Among TTW participants, 70 percent see <strong>the</strong>mselves working in <strong>the</strong> next year, and 80percent see <strong>the</strong>mselves working in <strong>the</strong> next five years. Among employed beneficiaries,however, 86 percent see <strong>the</strong>mselves working in <strong>the</strong> next year, but only 71 percent see<strong>the</strong>mselves working in <strong>the</strong> next five years. The difference between TTW participants andemployed beneficiaries in terms <strong>of</strong> <strong>the</strong> direction <strong>of</strong> <strong>the</strong>ir expectations over five years may bepartly connected <strong>to</strong> <strong>the</strong> fact that 20 percent <strong>of</strong> employed beneficiaries are age 55 or older,whereas just 12 percent <strong>of</strong> TTW participants are that age (shown in Figure III.1). Thedifference may also be a function <strong>of</strong> greater optimism about employment among TTWparticipants who are not yet working, relative <strong>to</strong> employed beneficiaries whose expectationsare influenced by <strong>the</strong> realities <strong>of</strong> <strong>the</strong>ir current work experiences.Overall, 7 percent <strong>of</strong> beneficiaries see <strong>the</strong>mselves earning enough <strong>to</strong> s<strong>to</strong>p receivingbenefits in <strong>the</strong> next year, and 15 percent feel <strong>the</strong> same way about <strong>the</strong> next five years (FigureIII.15). Focusing only on beneficiaries with future work expectations, among thoseexpecting <strong>to</strong> work in <strong>the</strong> next year, 37 percent see <strong>the</strong>mselves earning enough <strong>to</strong> leave <strong>the</strong>rolls in <strong>the</strong> next year, and among those who see <strong>the</strong>mselves working in <strong>the</strong> next five years, 58percent see <strong>the</strong>mselves earning enough <strong>to</strong> leave <strong>the</strong> rolls in that time frame. While employedbeneficiaries and TTW participants appear <strong>to</strong> be more optimistic than beneficiaries ingeneral, a greater proportion <strong>of</strong> TTW participants than employed beneficiaries see<strong>the</strong>mselves earning enough <strong>to</strong> s<strong>to</strong>p receiving benefits. Specifically, 28 percent <strong>of</strong> TTWbeneficiaries and 18 percent <strong>of</strong> employed beneficiaries see <strong>the</strong>mselves earning enough <strong>to</strong>47III: Beneficiary Characteristics and Employment Perspectives


