Evaluation of the Ticket to Work Program, Implementation ...
Evaluation of the Ticket to Work Program, Implementation ...
Evaluation of the Ticket to Work Program, Implementation ...
You also want an ePaper? Increase the reach of your titles
YUMPU automatically turns print PDFs into web optimized ePapers that Google loves.
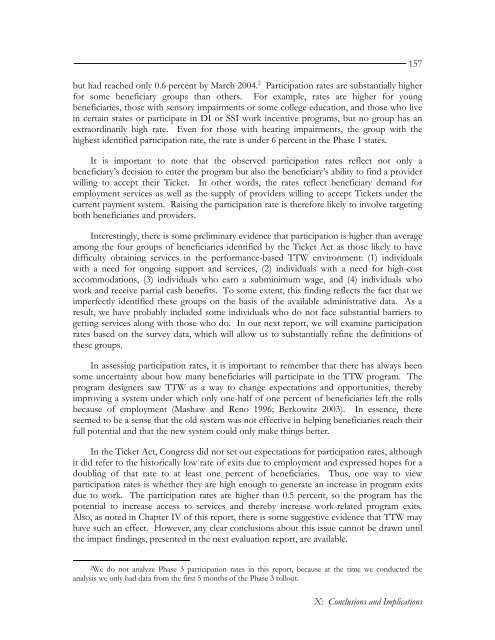
ut had reached only 0.6 percent by March 2004. 2 Participation rates are substantially higherfor some beneficiary groups than o<strong>the</strong>rs. For example, rates are higher for youngbeneficiaries, those with sensory impairments or some college education, and those who livein certain states or participate in DI or SSI work incentive programs, but no group has anextraordinarily high rate. Even for those with hearing impairments, <strong>the</strong> group with <strong>the</strong>highest identified participation rate, <strong>the</strong> rate is under 6 percent in <strong>the</strong> Phase 1 states.It is important <strong>to</strong> note that <strong>the</strong> observed participation rates reflect not only abeneficiary’s decision <strong>to</strong> enter <strong>the</strong> program but also <strong>the</strong> beneficiary’s ability <strong>to</strong> find a providerwilling <strong>to</strong> accept <strong>the</strong>ir <strong>Ticket</strong>. In o<strong>the</strong>r words, <strong>the</strong> rates reflect beneficiary demand foremployment services as well as <strong>the</strong> supply <strong>of</strong> providers willing <strong>to</strong> accept <strong>Ticket</strong>s under <strong>the</strong>current payment system. Raising <strong>the</strong> participation rate is <strong>the</strong>refore likely <strong>to</strong> involve targetingboth beneficiaries and providers.Interestingly, <strong>the</strong>re is some preliminary evidence that participation is higher than averageamong <strong>the</strong> four groups <strong>of</strong> beneficiaries identified by <strong>the</strong> <strong>Ticket</strong> Act as those likely <strong>to</strong> havedifficulty obtaining services in <strong>the</strong> performance-based TTW environment: (1) individualswith a need for ongoing support and services, (2) individuals with a need for high-costaccommodations, (3) individuals who earn a subminimum wage, and (4) individuals whowork and receive partial cash benefits. To some extent, this finding reflects <strong>the</strong> fact that weimperfectly identified <strong>the</strong>se groups on <strong>the</strong> basis <strong>of</strong> <strong>the</strong> available administrative data. As aresult, we have probably included some individuals who do not face substantial barriers <strong>to</strong>getting services along with those who do. In our next report, we will examine participationrates based on <strong>the</strong> survey data, which will allow us <strong>to</strong> substantially refine <strong>the</strong> definitions <strong>of</strong><strong>the</strong>se groups.In assessing participation rates, it is important <strong>to</strong> remember that <strong>the</strong>re has always beensome uncertainty about how many beneficiaries will participate in <strong>the</strong> TTW program. Theprogram designers saw TTW as a way <strong>to</strong> change expectations and opportunities, <strong>the</strong>rebyimproving a system under which only one-half <strong>of</strong> one percent <strong>of</strong> beneficiaries left <strong>the</strong> rollsbecause <strong>of</strong> employment (Mashaw and Reno 1996; Berkowitz 2003). In essence, <strong>the</strong>reseemed <strong>to</strong> be a sense that <strong>the</strong> old system was not effective in helping beneficiaries reach <strong>the</strong>irfull potential and that <strong>the</strong> new system could only make things better.In <strong>the</strong> <strong>Ticket</strong> Act, Congress did not set out expectations for participation rates, althoughit did refer <strong>to</strong> <strong>the</strong> his<strong>to</strong>rically low rate <strong>of</strong> exits due <strong>to</strong> employment and expressed hopes for adoubling <strong>of</strong> that rate <strong>to</strong> at least one percent <strong>of</strong> beneficiaries. Thus, one way <strong>to</strong> viewparticipation rates is whe<strong>the</strong>r <strong>the</strong>y are high enough <strong>to</strong> generate an increase in program exitsdue <strong>to</strong> work. The participation rates are higher than 0.5 percent, so <strong>the</strong> program has <strong>the</strong>potential <strong>to</strong> increase access <strong>to</strong> services and <strong>the</strong>reby increase work-related program exits.Also, as noted in Chapter IV <strong>of</strong> this report, <strong>the</strong>re is some suggestive evidence that TTW mayhave such an effect. However, any clear conclusions about this issue cannot be drawn until<strong>the</strong> impact findings, presented in <strong>the</strong> next evaluation report, are available.1572 We do not analyze Phase 3 participation rates in this report, because at <strong>the</strong> time we conducted <strong>the</strong>analysis we only had data from <strong>the</strong> first 5 months <strong>of</strong> <strong>the</strong> Phase 3 rollout.X: Conclusions and Implications


