<strong>City</strong> <strong>of</strong> <strong>Hoquiam</strong>Revenue Forecasting Model001 - GENERAL FUNDRevenue History and Projections:Actual Actual Actual Actual Actual Actual Actual Actual Forecast <strong>Budget</strong> <strong>Budget</strong>Description 2000 2001 2002 2003 2004 2005 2006 2007 2008 <strong>2009</strong> 20<strong>10</strong>BARS # INTERGOVERNMENTAL331.<strong>10</strong>.70.00 USDA Grant Pol Cars 0 0 0 0 0 0 0 25,000 0 0 0331.15.91.00 Save Amer. Treas Grant 0 0 0 0 0 0 0 0 0 0 0331.16.57Fed Grant-Justice Programs 15,000 0 32,251 26,862 15,887 0 0 0 0 0 0331.16.60.01 Bur <strong>of</strong> Justice-Vest 0 0 0 0 0 0 0 680 0 0331.16.60.02 Bur <strong>of</strong> Justice-02/03 Vest Grant 0 0 0 301 0 0 0 0 0 0 0331.16.60.04 Bur <strong>of</strong> Justice-03/04 Vest Grant 0 0 0 0 2,998 0 0 0 0 0 0331.83.00Fed Grant-Employee Training 334 0 254 0 0 0 0 0 0 0 0331.83.50Home Sec.-Police 0 0 0 0 0 0 8,437 0 0 0 0331.85.00Firefighter Assistance Grant 0 0 0 0 13,816 60,911 56,162 0 0 0 0332.15.00Pymt in Lieu <strong>of</strong> Tax-Dept <strong>of</strong> Int 3,378 2,634 2,730 2,236 2,126 2,011 2,427 1,777 2,000 2,000 2,000332.30.00In Lieu <strong>of</strong> Tax-Federal 424 424 0 0 0 0 0 0 0 0 0333.04.75Americorp Grant 75,700 0 0 0 0 0 0 64,968 62,870 0 0333.04.83FEMA Share Disaster Relief 0 0 14,808 0 -15,905 0 0 0 0 0 0333.06.91GH Co. Home Sec. 0 0 0 0 0 0 9,712 22,960 22,218 21,740 21,271333.14.22.80 CTED Plann. Grant 0 0 0 0 0 0 0 27,060 0 0 0333.16.00Local Law Enf Block Grant 9,999 6,562 0 9,999 9,999 9,999 0 0 0 0 0334.01.<strong>10</strong>.00 St. Crim Just Train 0 0 0 0 0 0 8,898 1,064 1,030 0 0334.03.00Traffic Safety Comm Grants 3,380 8,205 1,575 2,307 0 7,794 2,287 8,456 8,183 0 0334.04.21CDBG Funds Planning Serv 0 0 0 0 0 24,000 0 0 0 0 0334.04.22Gable Park Improvemnet 0 0 0 0 0 0 0 0 0 150,000 0334.04.24.00 CTED for Comp Plan 0 0 0 0 0 0 0 6,600 0 0 0334.04.29State Share Disaster Relief 0 0 2,468 0 0 0 0 0 0 0 0334.06.00L&I Grant for Trainee Costs 0 2,377 356 0 0 113 900 900 900 0 0335.00.81Trailer/RV Excise Tax 449 0 0 0 0 0 0 0 0 0 0335.00.83Motor Vehicle Excise Tax 23,690 0 0 0 0 0 0 0 0 0 0335.00.91PUD Priviledge Tax 54,757 52,587 64,4<strong>10</strong> 74,980 73,249 70,094 62,611 64,487 70,000 63,099 61,740336.00.85MV Excise Tax Equalization 122,248 0 0 0 0 0 0 0 0 0 0336.00.98<strong>City</strong> Assistance from State 0 0 44,000 16,600 11,<strong>10</strong>0 55,552 113,924 <strong>10</strong>5,553 <strong>10</strong>0,000 <strong>10</strong>0,000 <strong>10</strong>0,000336.04.22Local Government Assistance 547,090 374,903 0 0 0 0 0 0 0 0 0336.06.<strong>10</strong>Criminal Justice - High Crime 0 0 0 0 9,936 20,047 19,398 9,220 8,922 9,022 8,827336.06.21Criminal Justice - Per Capita 2,<strong>10</strong>1 1,595 1,550 1,541 1,594 1,645 1,691 1,746 2,000 2,020 2,020336.06.22Criminal Justice - DCD #1 2,187 1,728 1,673 1,732 0 0 0 0 0 0 0336.06.23Criminal Justice - DCD #2 3,069 2,517 2,444 2,549 0 0 0 0 0 0 0336.06.24Criminal Justice - DCD #3 3,067 2,515 2,441 2,560 0 0 0 0 0 0 0336.06.26Criminal Justice-Special 0 0 0 0 6,411 6,558 6,677 6,816 6,800 6,860 6,860336.06.51DUI Distribution 1,278 1,413 1,549 1,515 1,497 1,494 1,475 2,044 1,275 2,000 1,957336.06.94Liquor Excise Tax 29,392 30,551 31,782 32,026 34,279 36,354 38,060 40,297 38,000 44,325 44,325336.06.95Liquor Pr<strong>of</strong>its 54,588 48,979 49,408 56,273 64,185 63,018 57,582 64,704 66,000 64,640 64,640337.21.00Community Grants-Rec Prog 0 0 0 9,860 622 1,300 2,000 0 0 0 0338.21.01DTF Funding-Aberdeen Grant 27,321 26,365 19,917 18,521 26,215 22,185 27,374 25,031 0 11,380 0338.40.00State Traffic Control 15,<strong>10</strong>4 15,<strong>10</strong>4 15,<strong>10</strong>4 15,<strong>10</strong>4 15,<strong>10</strong>4 15,<strong>10</strong>4 15,<strong>10</strong>4 8,968 15,<strong>10</strong>5 0 0338.54.01FEMA Firefighter Grant 1,703 1,006 0 0 0 0 0 0 0 0 0TOTAL : $996,259 $579,465 $288,720 $274,966 $273,113 $398,179 $434,720 $488,330 $405,302 $477,085 $313,641Annual % Change: -41.8% -50.2% -4.8% -0.7% 45.8% 9.2% 12.3% -17.0% 17.7% -34.3%Average % Change since 2000 -41.8% -46.0% -32.3% -24.4% -<strong>10</strong>.3% -7.1% -4.3% -5.9% -3.3% -6.4%49
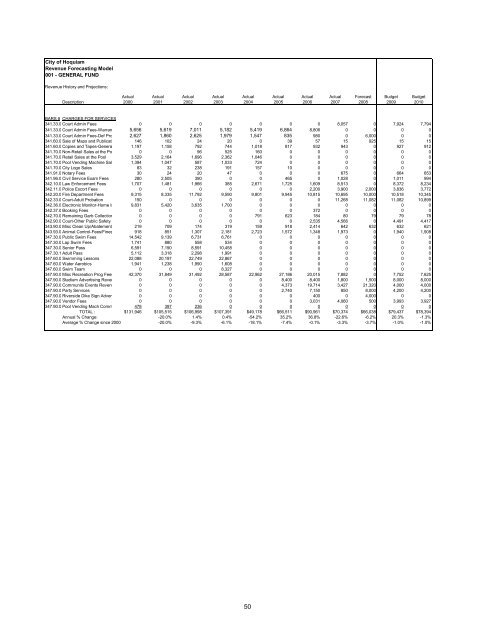
<strong>City</strong> <strong>of</strong> <strong>Hoquiam</strong>Revenue Forecasting Model001 - GENERAL FUNDRevenue History and Projections:Actual Actual Actual Actual Actual Actual Actual Actual Forecast <strong>Budget</strong> <strong>Budget</strong>Description 2000 2001 2002 2003 2004 2005 2006 2007 2008 <strong>2009</strong> 20<strong>10</strong>BARS # CHARGES FOR SERVICES341.33.00.00 Court Admin Fees 0 0 0 0 0 0 0 8,057 0 7,924 7,794341.33.02Court Admin Fees-Warrants 5,656 5,619 7,011 5,182 5,419 6,864 8,806 0 0 0 0341.33.03Court Admin Fees-Def Pros 2,627 1,860 2,625 1,979 1,547 835 980 0 6,000 0 0341.60.00Sale <strong>of</strong> Maps and Publications 146 <strong>10</strong>2 24 20 0 39 57 15 925 15 15341.60.00Copies and Tapes-General 1,197 1,158 792 744 1,018 817 932 943 0 927 912341.70.01Non-Retail Sales at the Pool 0 0 96 525 160 0 0 0 0 0 0341.70.02Retail Sales at the Pool 3,529 2,164 1,696 2,362 1,046 0 0 0 0 0 0341.70.03Pool Vending Machine Sales 1,394 1,047 587 1,033 724 0 0 0 0 0 0341.70.04<strong>City</strong> Logo Sales 83 32 238 191 157 <strong>10</strong> 0 0 0 0 0341.91.00Notary Fees 30 24 20 47 0 0 0 675 0 664 653341.96.00Civil Service Exam Fees 280 2,505 390 0 0 465 0 1,028 0 1,011 994342.<strong>10</strong>.00Law Enforcement Fees 1,707 1,481 1,966 385 2,671 1,725 1,609 8,513 0 8,372 8,234342.11.00Police Escort Fees 0 0 0 0 0 0 2,200 3,900 2,000 3,836 3,772342.20.00Fire Department Fees 9,315 8,335 11,792 9,590 9,801 9,945 <strong>10</strong>,815 <strong>10</strong>,695 <strong>10</strong>,000 <strong>10</strong>,518 <strong>10</strong>,345342.33.00Court-Adult Probation 150 0 0 0 0 0 0 11,268 11,082 11,082 <strong>10</strong>,899342.36.00Electronic Monitor-Home Incar 9,831 5,420 3,635 1,700 0 0 0 0 0 0 0342.37.00Booking Fees 0 0 0 0 0 0 372 0 0 0 0342.70.02Remaining Garb Collection 0 0 0 0 791 623 184 80 79 79 78342.90.00Court-Other Public Safety 0 0 0 0 0 0 2,535 4,566 0 4,491 4,417343.90.00Misc Clean Up/Abatement 219 709 174 319 159 918 2,414 642 632 632 621343.93.00Animal Control-Fees/Fines 918 851 1,307 2,181 2,723 1,572 1,348 1,973 0 1,940 1,908347.30.01Public Swim Fees 14,542 9,139 6,731 6,761 0 0 0 0 0 0 0347.30.02Lap Swim Fees 1,741 880 558 534 0 0 0 0 0 0 0347.30.07Senior Pass 6,591 7,190 8,591 <strong>10</strong>,458 0 0 0 0 0 0 0347.30.<strong>10</strong>Adult Pass 5,112 3,318 2,298 1,991 0 0 0 0 0 0 0347.60.01Swimming Lessons 22,088 20,197 22,749 22,867 0 0 0 0 0 0 0347.60.03Water Aerobics 1,941 1,238 1,990 1,608 0 0 0 0 0 0 0347.60.05Swim Team 0 0 0 8,327 0 0 0 0 0 0 0347.90.00Misc Recreation Prog Fees 42,370 31,849 31,492 28,587 22,962 27,186 20,015 7,882 0 7,752 7,625347.90.01Stadium Advertising Revenue 0 0 0 0 0 8,400 8,400 1,800 1,500 8,000 8,000347.90.02Community Events Revenue 0 0 0 0 0 4,373 19,714 3,427 21,320 4,000 4,000347.90.03Party Services 0 0 0 0 0 2,740 7,150 850 8,000 4,200 4,200347.90.04Riverside Dike Sign Advert 0 0 0 0 0 0 400 0 4,000 0 0347.90.06Vendor Fees 0 0 0 0 0 0 3,031 4,060 500 3,993 3,927347.90.09Pool Vending Mach Comm 478 397 236 0 0 0 0 0 0 0 0TOTAL : $131,946 $<strong>10</strong>5,515 $<strong>10</strong>6,998 $<strong>10</strong>7,391 $49,178 $66,511 $90,961 $70,374 $66,038 $79,437 $78,394Annual % Change: -20.0% 1.4% 0.4% -54.2% 35.2% 36.8% -22.6% -6.2% 20.3% -1.3%Average % Change since 2000 -20.0% -9.3% -6.1% -18.1% -7.4% -0.1% -3.3% -3.7% -1.0% -1.0%50