- Page 1 and 2:
2009-2010 ADOPTED OPERATING ANDCAPI
- Page 3:
This Page Intentionally Left Blank.
- Page 6 and 7:
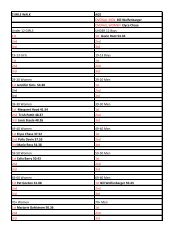
TABLE OF CONTENTSCITY OF HOQUIAMPRE
- Page 8 and 9:
CITY OF HOQUIAMORGANIZATIONAL CHART
- Page 10 and 11:
"The City of Hoquiam is poised for
- Page 12 and 13:
2007-2008 Budget Goals Scorecard &
- Page 17 and 18:
also contains an outline of the app
- Page 19 and 20:
Hoquiam’s Form of GovernmentHoqui
- Page 21 and 22:
History of HoquiamLong before Weste
- Page 23 and 24:
City Commissions and BoardsCivil Se
- Page 25 and 26:
This Page Intentionally Left Blank.
- Page 27 and 28:
Budget CalendarThe adoption of a bu
- Page 30 and 31:
III. GOALS AND POLICIESThis section
- Page 32 and 33:
POLICIESThe City Council developed
- Page 34 and 35: the highest level of service. Durin
- Page 36 and 37: 2) Sustain the current level of Cit
- Page 38 and 39: 5. Annually each department will re
- Page 40 and 41: 4.2 The Finance Department performs
- Page 42 and 43: 9.2 Change funds shall be controlle
- Page 44 and 45: IV. REVENUESThis section summarizes
- Page 46 and 47: 2. Voted Property Tax LevyAmount %
- Page 48 and 49: Sales Tax AllocationTelecommManufac
- Page 50 and 51: an amount we have determined to be
- Page 52 and 53: is $6,395 and $6,782 respectively.
- Page 54 and 55: help defray policing costs. Cities
- Page 56 and 57: Revenue by FundThis section summari
- Page 58 and 59: Intergovernmental revenues increase
- Page 60 and 61: 7,000,000Hoquiam 2009-2010 Budget20
- Page 62 and 63: CITY OF HOQUIAMASSESSED VALUE AND L
- Page 64 and 65: City of HoquiamRevenue Forecasting
- Page 66 and 67: City of HoquiamRevenue Forecasting
- Page 68 and 69: This Page Intentionally Left Blank.
- Page 70 and 71: 2,500,000City of Hoquiam 2009-2010
- Page 72 and 73: City of Hoquiam 2009-2010 BudgetCem
- Page 74 and 75: City of Hoquiam 2009-2010 BudgetMau
- Page 76 and 77: City of Hoquiam 2009-2010 BudgetStr
- Page 78 and 79: City of Hoquiam 2009-2010 BudgetArt
- Page 80 and 81: City of Hoquiam 2009-2010 BudgetAmb
- Page 82 and 83: City of Hoquiam 2009-2010 BudgetSta
- Page 86 and 87: City of HoquiamRevenue Forecasting
- Page 88 and 89: V. FUND SUMMARY SECTIONOverviewThe
- Page 90 and 91: 2009-2010 BUDGETALL FUNDS SUMMARYFU
- Page 92 and 93: A. General Fund - #001Overview:The
- Page 94 and 95: CITY OF HOQUIAM2009-2010 OPERATING
- Page 96 and 97: CITY OF HOQUIAM2009-2010 OPERATING
- Page 98 and 99: CITY OF HOQUIAM2009-2010 OPERATING
- Page 100 and 101: CITY OF HOQUIAM2009-2010 OPERATING
- Page 102 and 103: CITY OF HOQUIAM2009-2010 OPERATING
- Page 104 and 105: CITY OF HOQUIAM2009-2010 OPERATING
- Page 106 and 107: CITY OF HOQUIAM2009-2010 OPERATING
- Page 108 and 109: CITY OF HOQUIAM2009-2010 OPERATING
- Page 110 and 111: CITY OF HOQUIAM2009-2010 OPERATING
- Page 112 and 113: CITY OF HOQUIAM2009-2010 OPERATING
- Page 114 and 115: CITY OF HOQUIAM2009-2010 OPERATING
- Page 116 and 117: CITY OF HOQUIAM2009-2010 OPERATING
- Page 118 and 119: CITY OF HOQUIAM2009-2010 OPERATING
- Page 120 and 121: CITY OF HOQUIAM2009-2010 OPERATING
- Page 122 and 123: CITY OF HOQUIAM2009-2010 OPERATING
- Page 124 and 125: CITY OF HOQUIAM2009-2010 OPERATING
- Page 126 and 127: CITY OF HOQUIAM2009-2010 OPERATING
- Page 129 and 130: R. Medical Dental Fund - #520Overvi
- Page 131 and 132: S. Unemployment Compensation Fund -
- Page 133 and 134: T. Police and Fire Pension Fund - #
- Page 135 and 136:
This Page Intentionally Left Blank.
- Page 137 and 138:
Operating Budget Expenditures and S
- Page 139 and 140:
CITY OF HOQUIAM2009-2010 Operating
- Page 141 and 142:
CITY OF HOQUIAM2009-2010 BIENNIAL O
- Page 143 and 144:
CITY OF HOQUIAM2009-2010 BIENNIAL B
- Page 145 and 146:
CITY OF HOQUIAM2009-2010 BIENNIAL O
- Page 147 and 148:
CITY OF HOQUIAM2009-2010 BIENNIAL B
- Page 149 and 150:
CITY OF HOQUIAM2009-2010 BIENNIAL B
- Page 151 and 152:
CITY OF HOQUIAM2009-2010 BIENNIAL B
- Page 153 and 154:
CITY OF HOQUIAM2009-2010 BIENNIAL B
- Page 155 and 156:
CITY OF HOQUIAM2009-2010 BIENNIAL B
- Page 157 and 158:
CITY OF HOQUIAM2009-2010 BIENNIAL B
- Page 159 and 160:
DEPT Name: City Hall & BuildingsDEP
- Page 161 and 162:
CITY OF HOQUIAM2009-2010 BIENNIAL B
- Page 163 and 164:
CITY OF HOQUIAM2009-2010 BIENNIAL B
- Page 165 and 166:
CITY OF HOQUIAM2009-2010 BIENNIAL B
- Page 167 and 168:
CITY OF HOQUIAM2009-2010 BIENNIAL B
- Page 169 and 170:
CITY OF HOQUIAM2009-2010 BIENNIAL B
- Page 171 and 172:
CITY OF HOQUIAM2009-2010 BIENNIAL B
- Page 173 and 174:
CITY OF HOQUIAM2009-2010 BIENNIAL O
- Page 175 and 176:
CITY OF HOQUIAM2009-2010 BIENNIAL B
- Page 177 and 178:
CITY OF HOQUIAM2009-2010 BIENNIAL O
- Page 179 and 180:
CITY OF HOQUIAM2009-2010 BIENNIAL B
- Page 181 and 182:
CITY OF HOQUIAM2009-2010 BIENNIAL B
- Page 183 and 184:
CITY OF HOQUIAM2009-2010 BIENNIAL O
- Page 185 and 186:
CITY OF HOQUIAM2009-2010 BIENNIAL B
- Page 187 and 188:
CITY OF HOQUIAM2009-2010 BIENNIAL O
- Page 189 and 190:
CITY OF HOQUIAM2009-2010 BIENNIAL B
- Page 191 and 192:
CITY OF HOQUIAM2009-2010 BIENNIAL O
- Page 193 and 194:
CITY OF HOQUIAM2009-2010 BIENNIAL O
- Page 195 and 196:
CITY OF HOQUIAM2009-2010 BIENNIAL O
- Page 197 and 198:
CITY OF HOQUIAM1008 BIENNIAL BUDGET
- Page 199 and 200:
CITY OF HOQUIAM2009-2010 BIENNIAL O
- Page 201 and 202:
CITY OF HOQUIAM2009-2010 BIENNIAL B
- Page 203 and 204:
CITY OF HOQUIAM2009-2010 BIENNIAL O
- Page 205 and 206:
CITY OF HOQUIAM2009-2010 BIENNIAL O
- Page 207 and 208:
CITY OF HOQUIAM2009-2010 BIENNIAL B
- Page 209 and 210:
CITY OF HOQUIAM2009-2010 BIENNIAL O
- Page 211 and 212:
CITY OF HOQUIAM2009-2010 BIENNIAL B
- Page 213 and 214:
CITY OF HOQUIAM2009-2010 BIENNIAL O
- Page 215 and 216:
CITY OF HOQUIAM2009-2010 BIENNIAL B
- Page 217 and 218:
CITY OF HOQUIAM2009-2010 BIENNIAL O
- Page 219 and 220:
CITY OF HOQUIAM2009-2010 BIENNIAL B
- Page 221 and 222:
CITY OF HOQUIAM2009-2010 BIENNIAL O
- Page 223 and 224:
CITY OF HOQUIAM2009-2010 BIENNIAL B
- Page 225 and 226:
DEPT Name: Landfill PostclosureDEPT
- Page 227 and 228:
CITY OF HOQUIAM2009-2010 BIENNIAL O
- Page 229 and 230:
CITY OF HOQUIAM2009-2010 BIENNIAL B
- Page 231 and 232:
CITY OF HOQUIAM2009-2010 CAPITAL IM
- Page 233 and 234:
CITY OF HOQUIAM2009-2010 CAPITAL BU
- Page 235 and 236:
CITY OF HOQUIAM2009-2010 CAPITAL BU
- Page 237 and 238:
CITY OF HOQUIAM2009-2010 CAPITAL BU
- Page 239 and 240:
CITY OF HOQUIAM2009-2010 CAPITAL BU
- Page 241 and 242:
2009 2010Beginning 2009-2010 2009-2
- Page 243 and 244:
CITY OF HOQUIAM2010 Remaining Debt
- Page 245 and 246:
CITY OF HOQUIAM2009-2010 BudgetDEBT
- Page 247 and 248:
FUND NUMBER: 401-25DESCRIPTION: Wat
- Page 249 and 250:
FUND NUMBER: 401-26DESCRIPTION: Sew
- Page 251 and 252:
A. Adopted Utility Rates236
- Page 253 and 254:
This Page Intentionally Left Blank.
- Page 255 and 256:
APPENDIX B2009-2010 Operating and C
- Page 257 and 258:
APPENDIX B2009-2010 Operating and C
- Page 259 and 260:
APPENDIX B2009-2010 Operating and C
- Page 261 and 262:
APPENDIX B2009-2010 Operating and C
- Page 263 and 264:
APPENDIX B2009-2010 Operating and C
- Page 265 and 266:
APPENDIX B2009-2010 Operating and C
- Page 267 and 268:
APPENDIX B2009-2010 Operating and C
- Page 269 and 270:
This Page Intentionally Left Blank.
- Page 271 and 272:
This Page Intentionally Left Blank.
- Page 273 and 274:
City of Hoquiam2009-2010 Budget Dev
- Page 275:
302 Sidewalk Construction Miscellan