2009-10 Adopted Budget - City of Hoquiam
2009-10 Adopted Budget - City of Hoquiam
2009-10 Adopted Budget - City of Hoquiam
- No tags were found...

Create successful ePaper yourself
Turn your PDF publications into a flip-book with our unique Google optimized e-Paper software.
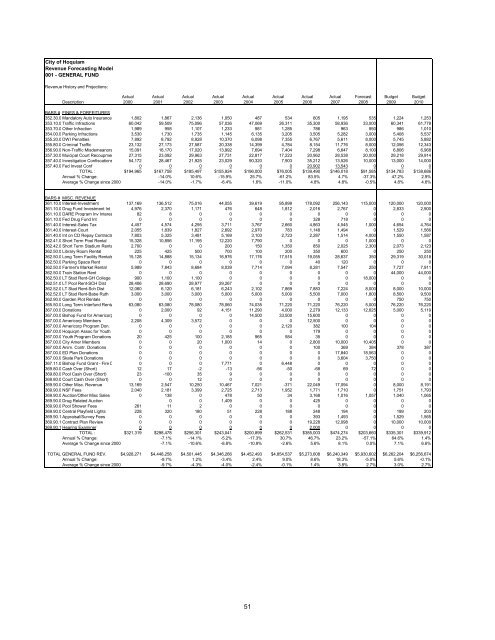
<strong>City</strong> <strong>of</strong> <strong>Hoquiam</strong>Revenue Forecasting Model001 - GENERAL FUNDRevenue History and Projections:Actual Actual Actual Actual Actual Actual Actual Actual Forecast <strong>Budget</strong> <strong>Budget</strong>Description 2000 2001 2002 2003 2004 2005 2006 2007 2008 <strong>2009</strong> 20<strong>10</strong>BARS # FINES & FORFEITURES352.30.00Mandatory Auto Insurance 1,802 1,867 2,136 1,050 487 534 605 1,195 535 1,224 1,253353.<strong>10</strong>.00Traffic Infractions 60,042 59,509 75,096 57,036 47,069 26,311 35,300 58,936 33,000 60,341 61,779353.70.00Other Infraction 1,989 958 1,<strong>10</strong>7 1,233 981 1,285 786 963 950 986 1,0<strong>10</strong>354.00.00Parking Infractions 3,530 1,730 1,735 1,145 6,135 3,205 3,505 5,282 3,000 5,408 5,537355.20.00DWI Penalties 7,892 8,792 8,928 <strong>10</strong>,370 6,098 7,355 6,767 5,611 8,000 5,745 5,882355.80.00Criminal Traffic 23,132 27,173 27,587 20,338 14,399 4,784 8,154 11,776 8,000 12,056 12,343356.90.00Non-Traffic Misdemeanors 15,091 16,170 17,020 13,992 7,694 7,404 7,298 6,647 8,<strong>10</strong>0 6,806 6,968357.30.00Muicipal Court Recoupments 27,315 23,092 29,963 27,731 22,817 17,223 20,962 28,538 20,000 29,218 29,914357.40.00Investigation Confiscations 54,172 28,467 21,925 23,029 90,320 7,903 35,212 13,526 <strong>10</strong>,000 13,000 14,000357.40.01Fed Invest Conf 0 0 0 0 0 0 20,902 13,543 0 0 0TOTAL : $194,965 $167,758 $185,497 $155,924 $196,000 $76,005 $139,490 $146,018 $91,585 $134,783 $138,686Annual % Change: -14.0% <strong>10</strong>.6% -15.9% 25.7% -61.2% 83.5% 4.7% -37.3% 47.2% 2.9%Average % Change since 2000 -14.0% -1.7% -6.4% 1.6% -11.0% 4.8% 4.8% -0.5% 4.8% 4.6%BARS # MISC. REVENUE361.<strong>10</strong>.00Interest-Investment 137,169 136,512 75,016 44,055 39,619 95,899 178,092 256,143 115,000 120,000 120,000361.<strong>10</strong>.01Drug Fund Investment Int 4,976 2,370 1,171 476 648 1,812 2,016 2,767 0 2,833 2,900361.<strong>10</strong>.02DARE Program Inv Interest 82 8 0 0 0 0 0 0 0 0 0361.<strong>10</strong>.03Fed Drug Fund Int 0 0 0 0 0 0 328 718 0 0 0361.40.00Interest-Sales Tax 4,457 4,574 4,295 3,711 3,767 2,660 4,863 4,545 1,000 4,654 4,764361.40.01Interest-Court 2,055 1,839 1,827 2,692 2,970 783 1,148 1,494 0 1,529 1,566361.40.02Int on CD Repay Contracts 7,803 5,325 3,481 5,169 3,<strong>10</strong>3 2,723 2,287 1,514 4,000 1,550 1,587362.41.00Short Term Pool Rental 15,328 <strong>10</strong>,856 11,195 12,220 7,790 0 0 0 1,000 0 0362.42.00Short Term Stadium Rents 2,700 0 0 200 150 1,350 850 2,025 2,300 2,073 2,123362.50.00Library Room Rental 225 425 500 700 <strong>10</strong>0 200 350 600 0 250 250362.50.00Long Term Facility Rentals 15,128 14,888 15,134 16,976 17,176 17,515 19,055 28,637 350 29,319 30,018362.50.01Parking Space Rent 0 0 0 0 0 0 40 120 0 0 0362.50.02Farmer's Market Rental 5,989 7,843 8,684 8,039 7,714 7,094 8,281 7,547 250 7,727 7,911362.50.03Train Station Rent 0 0 0 0 0 0 0 0 0 44,000 44,000362.50.05LT Stad Rent-GH College 900 1,<strong>10</strong>0 1,<strong>10</strong>0 0 0 0 0 0 18,000 0 0362.51.01LT Pool Rent-SCH Dist 28,406 28,690 28,977 29,267 0 0 0 0 0 0 0362.52.01LT Stad Rent-Sch Dist 12,060 6,120 6,181 6,243 2,<strong>10</strong>2 7,869 7,883 7,224 8,000 8,000 <strong>10</strong>,000362.52.02LT Stad Rent-Babe Ruth 3,000 3,000 3,000 5,000 5,000 5,000 5,500 7,000 1,800 8,500 9,500362.90.01Garden Plot Rentals 0 0 0 0 0 0 0 0 0 750 750365.50.00Long Term Interfund Rentals 63,080 63,080 78,080 78,060 74,035 71,220 71,220 76,220 5,000 76,220 76,220367.00.00Donations 0 2,000 92 4,151 11,290 4,000 2,279 12,133 12,625 5,000 5,119367.00.01Bishop Fund for Americorp 0 0 0 0 14,500 33,500 15,600 0 0 0 0367.00.02Americorp Members 2,208 4,309 3,572 0 0 0 12,500 0 0 0 0367.00.03Americorp Program Don. 0 0 0 0 0 2,120 382 <strong>10</strong>0 <strong>10</strong>4 0 0367.00.04Hoquiqm Assoc for Youth 0 0 0 0 0 0 179 0 0 0 0367.00.05Youth Program Donations 20 425 <strong>10</strong>0 2,185 965 584 35 0 0 0 0367.00.06<strong>City</strong> Amer Members 0 0 20 1,000 14 0 2,800 <strong>10</strong>,000 <strong>10</strong>,405 0 0367.00.07Anim. Contr. Donations 0 0 0 0 0 0 <strong>10</strong>0 369 384 378 387367.00.08ED Plan Donations 0 0 0 0 0 0 0 17,840 18,563 0 0367.00.09Skate Park Donations 0 0 0 0 0 0 0 3,604 3,750 0 0367.11.09Bishop Fund Grant - Fire Dept 0 0 0 7,771 0 6,448 0 0 0 0 0369.80.00Cash Over (Short) 12 17 -2 -13 -56 -50 -68 69 72 0 0369.80.01Pool Cash Over (Short) 23 -<strong>10</strong>0 35 9 0 0 0 0 0 0 0369.80.02Court Cash Over (Short) 0 0 12 0 0 0 0 0 0 0 0369.90.00Other Misc. Revenue 13,169 2,547 <strong>10</strong>,250 <strong>10</strong>,467 7,021 -371 22,049 17,094 0 8,000 8,191369.90.01NSF Fees 2,040 2,181 3,399 2,725 2,713 1,952 1,771 1,7<strong>10</strong> 0 1,751 1,793369.90.02Auction/Other Misc Sales 0 138 0 478 50 34 3,168 1,016 1,057 1,040 1,065369.90.05Drug Related Auction 0 0 1,409 0 0 425 0 0 0 0369.90.06Pool Shower Fees 261 11 2 0 0 0 0 0 0 0 0369.90.09Central Playfield Lights 228 320 180 51 228 188 248 194 0 199 203369.90.<strong>10</strong>Appraisal/Survey Fees 0 0 0 0 0 0 393 1,493 0 1,529 1,565369.90.11Contract Plan Review 0 0 0 0 0 0 19,228 12,098 0 <strong>10</strong>,000 <strong>10</strong>,000369.90.12Hearing Examiner 0 0 0 0 0 0 2,000 0 0 0 0TOTAL : $321,319 $298,478 $256,301 $243,041 $200,899 $262,531 $385,003 $474,274 $203,660 $335,301 $339,912Annual % Change: -7.1% -14.1% -5.2% -17.3% 30.7% 46.7% 23.2% -57.1% 64.6% 1.4%Average % Change since 2000 -7.1% -<strong>10</strong>.6% -8.8% -<strong>10</strong>.9% -2.6% 5.6% 8.1% 0.0% 7.1% 6.6%TOTAL GENERAL FUND REV. $4,928,271 $4,448,258 $4,501,445 $4,346,266 $4,452,493 $4,854,537 $5,273,608 $6,240,349 $5,930,602 $6,262,204 $6,256,674Annual % Change: -9.7% 1.2% -3.4% 2.4% 9.0% 8.6% 18.3% -5.0% 5.6% -0.1%Average % Change since 2000 -9.7% -4.3% -4.0% -2.4% -0.1% 1.4% 3.8% 2.7% 3.0% 2.7%51