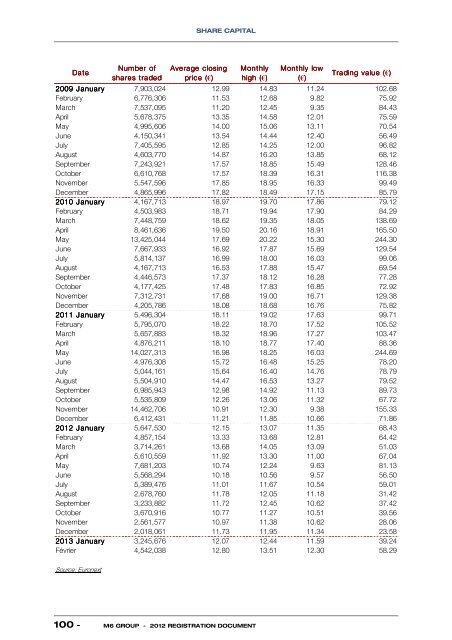
SHARE CAPITALDateNumber ofshares tradedAverage closingprice (€)(Monthlyhigh (€)(Monthly low(€)Trading value (€)(2009 January 7,903,024 12.99 14.83 11.24 102.68February 6,776,306 11.53 12.68 9.82 75.92March 7,537,095 11.20 12.45 9.35 84.43April 5,678,375 13.35 14.58 12.01 75.59May 4,995,606 14.00 15.06 13.11 70.54June 4,150,341 13.54 14.44 12.40 56.49July 7,405,595 12.85 14.25 12.00 96.82August 4,603,770 14.87 16.20 13.85 68.12September 7,243,921 17.57 18.85 15.49 128.46Oc<strong>to</strong>ber 6,610,768 17.57 18.39 16.31 116.38November 5,547,596 17.85 18.95 16.33 99.49December 4,865,996 17.82 18.49 17.15 85.792010 January 4,167,713 18.97 19.70 17.86 79.12February 4,503,983 18.71 19.94 17.90 84.29March 7,448,759 18.62 19.35 18.05 138.69April 8,461,636 19.50 20.16 18.91 165.50May 13,425,044 17.69 20.22 15.30 244.30June 7,667,933 16.92 17.87 15.69 129.54July 5,814,137 16.99 18.00 16.03 99.06August 4,167,713 16.53 17.88 15.47 69.54September 4,446,573 17.37 18.12 16.28 77.28Oc<strong>to</strong>ber 4,177,425 17.48 17.83 16.85 72.92November 7,312,731 17.68 19.00 16.71 129.38December 4,205,786 18.08 18.68 16.76 75.822011 January 5,496,304 18.11 19.02 17.63 99.71February 5,795,070 18.22 18.70 17.52 105.52March 5,657,883 18.32 18.96 17.27 103.47April 4,876,211 18.10 18.77 17.40 88.36May 14,027,313 16.98 18.25 16.03 244.69June 4,976,308 15.72 16.48 15.25 78.20July 5,044,161 15.64 16.40 14.76 78.79August 5,504,910 14.47 16.53 13.27 79.52September 6,985,943 12.98 14.92 11.13 89.73Oc<strong>to</strong>ber 5,535,809 12.26 13.06 11.32 67.72November 14,462,706 10.91 12.30 9.38 155.33December 6,412,431 11.21 11.85 10.66 71.86<strong>2012</strong> January 5,647,530 12.15 13.07 11.35 68.43February 4,857,154 13.33 13.68 12.81 64.42March 3,714,261 13.68 14.05 13.09 51.03April 5,610,559 11.92 13.30 11.00 67.04May 7,681,203 10.74 12.24 9.63 81.13June 5,568,294 10.18 10.56 9.57 56.50July 5,389,476 11.01 11.67 10.54 59.01August 2,678,760 11.78 12.05 11.18 31.42September 3,233,882 11.72 12.45 10.62 37.42Oc<strong>to</strong>ber 3,670,916 10.77 11.27 10.51 39.56November 2,561,577 10.97 11.38 10.62 28.06December 2,018,061 11.73 11.95 11.34 23.582013 January 3,245,676 12.07 12.44 11.59 39.24Février 4,542,038 12.80 13.51 12.30 58.29Source: Euronext100 - <strong>M6</strong> GROUP - <strong>2012</strong> REGISTRATION DOCUMENT
SHARE CAPITAL3.4. Cash dividend policyCash dividends paid over <strong>the</strong> last 5 financial years were as follows:2011 2010 2009 2008 2007Ordinary dividend €1.00 €1.00 €0.85 €0.85 €1.00Extraordinary dividend - € - € €1.50 - € - €Net dividend per share €1.00€1.00€2.35€0.85€1.00Tax credit - - - - -Gross dividend €1.00 €1.00 €2.35 €0.85 €1.00Yield (based on closing share price) 8.7% 5.5% 13,1% 6.1% 5.6%Pay-out Ratio - Group share ofcontinuing operations) 84.4% 82.1% 217.9% 79.2% 77.0%With regard <strong>to</strong> its financial and cash flow generation position and net profit, <strong>M6</strong> Group proposed <strong>to</strong> <strong>the</strong>Annual General Meeting of 3 May <strong>2012</strong> <strong>the</strong> payment of an ordinary dividend of €1.00 per share for <strong>the</strong>2011 financial year, corresponding <strong>to</strong> a pay-out ratio of 84.4% of <strong>the</strong> Group’s share of consolidated netprofit and a yield of 8.7% (calculated based on <strong>the</strong> 2011 closing price).In respect of <strong>the</strong> <strong>2012</strong> financial year, a proposal will be submitted for approval <strong>to</strong> <strong>the</strong> Ordinary GeneralMeeting of 13 May 2013 for <strong>the</strong> payment of an ordinary cash dividend of €0.85 per share, corresponding<strong>to</strong> a pay-out ratio of 76.3% of <strong>the</strong> Group’s share of consolidated net profit, and of an extraordinary cashdividend of €1.00 per share, making a <strong>to</strong>tal cash dividend of €1.85 per share. Including <strong>the</strong> extraordinarycash dividend, <strong>the</strong> yield is 15.7% calculated based on <strong>the</strong> <strong>2012</strong> closing price (7.2% excludingextraordinary cash dividend).The Amending Law n° 2011-894 of 28 July 2011 on <strong>the</strong> financing of social security, published in <strong>the</strong>Journal Officiel on 29 July 2011, requires certain employers <strong>to</strong> pay a bonus <strong>to</strong> <strong>the</strong>ir employees whendividends paid <strong>to</strong> shareholders or partners increase.This obligation covers commercial companies with a workforce of 50 or more and whose dividends haveincreased compared <strong>to</strong> <strong>the</strong> average of <strong>the</strong> previous two financial years.The <strong>M6</strong> Group is <strong>the</strong>refore concerned by this mechanism in <strong>2012</strong> as <strong>the</strong> average of dividends paid over<strong>the</strong> last two years was €1.00 for a <strong>to</strong>tal proposed dividend of €1.85 for <strong>the</strong> <strong>2012</strong> financial year. Theamount of this bonus will be negotiated with trade unions after <strong>the</strong> Shareholders’ General Meeting hasdelivered its opinion on <strong>the</strong> dividend <strong>to</strong> be paid for <strong>the</strong> <strong>2012</strong> financial year.3.5. Main shareholders at 31 December <strong>2012</strong>At 31 D e ce mbe r <strong>2012</strong> At 31 D ec embe r 2011 At 31 D ec ember 2010%%Number of% sha reNumbe r ofNumber of% sha reNumbe r ofNumbe r of% sharevotingvotingshare sc apita lvoting rightsshare sc apita lvoting rightssha resca pitalrightsrightsNumber ofvoting rights%votingrightsRTL Group 61,007,471 48.46% 42,578,509 34.00% 61,487,471 48.65% 42,578,509 34.00% 62,447,471 48.42% 42,920,487 34.00%<strong>Groupe</strong>CompagnieNationale à9,154,477 7.27% 9,154,477 7.31% 9,154,477 7.24% 9,154,477 7.31% 9,154,477 7.10% 9,154,477 7.25%Portefe uilleTre asury share s 653,054 0.52% - 0.00% 147,237 0.12% - 0.00% 460,004 0.36% - 0.00%FCPE <strong>M6</strong> Personnel 160,900 0.13% 160,900 0.13% 142,700 0.11% 142,700 0.11% 136,130 0.11% 136,130 0.11%Fre efloa t 54,908,062 43.62% 54,908,062 43.85% 55,452,079 43.88% 55,452,079 44.28% 56,759,857 44.01% 56,759,857 44.96%in Fra nc e 23,499,370 18.67% 23,499,370 18.76% 25,575,880 20.24% 25,575,880 20.42% 23,515,009 18.23% 23,515,009 18.63%in o<strong>the</strong>r countrie s 31,408,692 24.95% 31,408,692 25.08% 29,876,199 23.64% 29,876,199 23.86% 33,244,848 25.78% 33,244,848 26.34%Total 125,883,964 100.0% 106,801,948 85.28% 126,383,964 100.0% 107,327,765 85.70% 128,957,939 100.0% 108,970,951 86.32%<strong>M6</strong> GROUP - <strong>2012</strong> REGISTRATION DOCUMENT - 101