- Page 4:
DisclaimerThis report is an English
- Page 8:
M6 GROUP PRESENTATION1. M6 Group pr
- Page 13 and 14:
M6 GROUP PRESENTATION1.4.2. 2012 fi
- Page 15 and 16:
M6 GROUP PRESENTATION• Another am
- Page 17 and 18:
M6 GROUP PRESENTATIONIn total, the
- Page 19 and 20:
M6 GROUP PRESENTATIONIndividual Wat
- Page 21 and 22:
M6 GROUP PRESENTATION Historic chan
- Page 23 and 24:
M6 GROUP PRESENTATIONThe top ten M6
- Page 25 and 26:
M6 GROUP PRESENTATIONChange in the
- Page 27 and 28:
M6 GROUP PRESENTATIONshown-before s
- Page 29 and 30:
M6 GROUP PRESENTATIONIn order to co
- Page 31 and 32:
M6 GROUP PRESENTATIONSND was the le
- Page 33 and 34:
M6 GROUP PRESENTATIONa) Business pr
- Page 35 and 36:
M6 GROUP PRESENTATIONExcerpt of Top
- Page 37 and 38:
M6 GROUP PRESENTATIONMistergooddeal
- Page 39 and 40:
M6 GROUP PRESENTATIONwill be built
- Page 41 and 42:
M6 GROUP PRESENTATIONSTATUTORY ALLO
- Page 43 and 44:
M6 GROUP PRESENTATIONHowever, a Gen
- Page 45 and 46:
M6 GROUP PRESENTATIONAs a network w
- Page 47 and 48:
M6 GROUP PRESENTATIONb) Provisions
- Page 49 and 50:
M6 GROUP PRESENTATIONThe amendment
- Page 51 and 52:
CORPORATE GOVERNANCECORPORATE GOVER
- Page 53 and 54:
CORPORATE GOVERNANCEMembers of the
- Page 55 and 56:
CORPORATE GOVERNANCE- Chairman of t
- Page 57 and 58:
CORPORATE GOVERNANCE- Manager of P7
- Page 59 and 60:
CORPORATE GOVERNANCEAppointments an
- Page 61 and 62:
CORPORATE GOVERNANCEDelphine ARNAUL
- Page 63 and 64:
CORPORATE GOVERNANCEThe missions an
- Page 65 and 66:
CORPORATE GOVERNANCE- Director of C
- Page 67 and 68:
CORPORATE GOVERNANCEcharge of imple
- Page 69 and 70:
CORPORATE GOVERNANCEJérôme Leféb
- Page 71 and 72:
CORPORATE GOVERNANCEa) Basis of com
- Page 73 and 74:
CORPORATE GOVERNANCEtwo years of ad
- Page 75 and 76:
CORPORATE GOVERNANCEb) Free shares
- Page 77 and 78:
CORPORATE GOVERNANCERobin LEPROUX 2
- Page 79 and 80:
CORPORATE GOVERNANCE- no family con
- Page 81 and 82:
CORPORATE GOVERNANCEEight of these
- Page 83 and 84:
CORPORATE GOVERNANCEMinutes are pre
- Page 85 and 86:
CORPORATE GOVERNANCEonce a year and
- Page 87 and 88:
CORPORATE GOVERNANCE• matters rel
- Page 89 and 90:
CORPORATE GOVERNANCE- Excluding Rob
- Page 91 and 92:
CORPORATE GOVERNANCE5.1.3 Allocatio
- Page 93 and 94:
CORPORATE GOVERNANCE- an Ethics Cha
- Page 95 and 96:
CORPORATE GOVERNANCEAt the balance
- Page 97 and 98:
CORPORATE GOVERNANCEbecoming famili
- Page 99 and 100:
CORPORATE GOVERNANCESHARE CAPITAL33
- Page 101 and 102:
SHARE CAPITALStock market performan
- Page 103 and 104:
SHARE CAPITAL3.4. Cash dividend pol
- Page 105 and 106: SHARE CAPITAL- At least one third o
- Page 107 and 108: SHARE CAPITALChange in the number o
- Page 109 and 110: SHARE CAPITALTreasury shares alloca
- Page 111 and 112: SHARE CAPITALDate of General Meetin
- Page 113 and 114: SHARE CAPITALDate of General Meetin
- Page 115 and 116: SHARE CAPITALControlled companies h
- Page 117 and 118: SHARE CAPITAL3.10.4.4. Identificati
- Page 119 and 120: RISK FACTORS AND MANAGEMENTRISK FAC
- Page 121 and 122: RISK FACTORS AND MANAGEMENT4.1.2. D
- Page 123 and 124: RISK FACTORS AND MANAGEMENT4.1.5. P
- Page 125 and 126: RISK FACTORS AND MANAGEMENTIt is po
- Page 127 and 128: RISK FACTORS AND MANAGEMENT4.5.3. R
- Page 129 and 130: RISK FACTORS AND MANAGEMENTc) Exclu
- Page 131 and 132: RISK FACTORS AND MANAGEMENT• the
- Page 133 and 134: RISK FACTORS AND MANAGEMENT4.7. Ind
- Page 135 and 136: 2012 FINANCIAL REPORT2012 FINANCIAL
- Page 137 and 138: 2012 FINANCIAL REPORT5.1.1.2. Conso
- Page 139 and 140: 2012 FINANCIAL REPORT5.1.2.2. M6 TV
- Page 141 and 142: 2012 FINANCIAL REPORTAdvertising an
- Page 143 and 144: 2012 FINANCIAL REPORT- the disposal
- Page 145 and 146: 2012 FINANCIAL REPORTthe reliabilit
- Page 147 and 148: 2012 FINANCIAL REPORTIt sets and de
- Page 149 and 150: 2012 FINANCIAL REPORTParent company
- Page 151 and 152: 2012 FINANCIAL REPORT5.4.3. Diversi
- Page 153 and 154: 2012 FINANCIAL REPORT2012 FINANCIAL
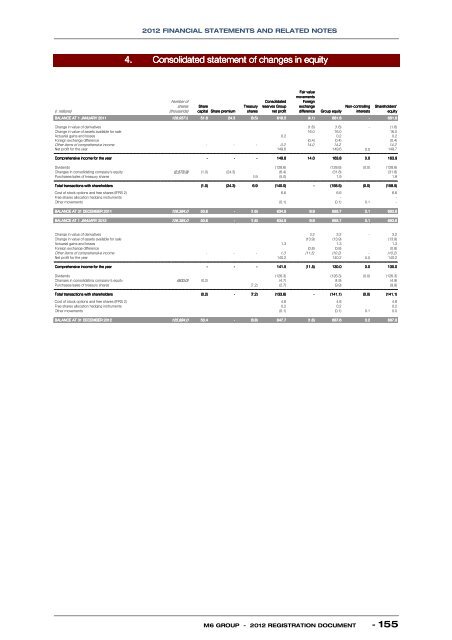
- Page 155: 2012 FINANCIAL STATEMENTS AND RELAT
- Page 159 and 160: 2012 FINANCIAL STATEMENTS AND RELAT
- Page 161 and 162: 2012 FINANCIAL STATEMENTS AND RELAT
- Page 163 and 164: 2012 FINANCIAL STATEMENTS AND RELAT
- Page 165 and 166: 2012 FINANCIAL STATEMENTS AND RELAT
- Page 167 and 168: 2012 FINANCIAL STATEMENTS AND RELAT
- Page 169 and 170: 2012 FINANCIAL STATEMENTS AND RELAT
- Page 171 and 172: 2012 FINANCIAL STATEMENTS AND RELAT
- Page 173 and 174: 2012 FINANCIAL STATEMENTS AND RELAT
- Page 175 and 176: 2012 FINANCIAL STATEMENTS AND RELAT
- Page 177 and 178: 2012 FINANCIAL STATEMENTS AND RELAT
- Page 179 and 180: 2012 FINANCIAL STATEMENTS AND RELAT
- Page 181 and 182: 2012 FINANCIAL STATEMENTS AND RELAT
- Page 183 and 184: 2012 FINANCIAL STATEMENTS AND RELAT
- Page 185 and 186: 2012 FINANCIAL STATEMENTS AND RELAT
- Page 187 and 188: 2012 FINANCIAL STATEMENTS AND RELAT
- Page 189 and 190: 2012 FINANCIAL STATEMENTS AND RELAT
- Page 191 and 192: 2012 FINANCIAL STATEMENTS AND RELAT
- Page 193 and 194: 2012 FINANCIAL STATEMENTS AND RELAT
- Page 195 and 196: 2012 FINANCIAL STATEMENTS AND RELAT
- Page 197 and 198: 2012 FINANCIAL STATEMENTS AND RELAT
- Page 199 and 200: 2012 FINANCIAL STATEMENTS AND RELAT
- Page 201 and 202: 2012 FINANCIAL STATEMENTS AND RELAT
- Page 203 and 204: 2012 FINANCIAL STATEMENTS AND RELAT
- Page 205 and 206: 2012 FINANCIAL STATEMENTS AND RELAT
- Page 207 and 208:
2012 FINANCIAL STATEMENTS AND RELAT
- Page 209 and 210:
2012 FINANCIAL STATEMENTS AND RELAT
- Page 211 and 212:
2012 FINANCIAL STATEMENTS AND RELAT
- Page 213 and 214:
2012 FINANCIAL STATEMENTS AND RELAT
- Page 215 and 216:
2012 FINANCIAL STATEMENTS AND RELAT
- Page 217 and 218:
2012 FINANCIAL STATEMENTS AND RELAT
- Page 219 and 220:
2012 FINANCIAL STATEMENTS AND RELAT
- Page 221 and 222:
2012 FINANCIAL STATEMENTS AND RELAT
- Page 223 and 224:
2012 FINANCIAL STATEMENTS AND RELAT
- Page 225 and 226:
2012 FINANCIAL STATEMENTS AND RELAT
- Page 227 and 228:
2012 FINANCIAL STATEMENTS AND RELAT
- Page 229 and 230:
2012 FINANCIAL STATEMENTS AND RELAT
- Page 231 and 232:
2012 FINANCIAL STATEMENTS AND RELAT
- Page 233 and 234:
2012 FINANCIAL STATEMENTS AND RELAT
- Page 235 and 236:
2012 FINANCIAL STATEMENTS AND RELAT
- Page 237 and 238:
2012 FINANCIAL STATEMENTS AND RELAT
- Page 239 and 240:
2012 FINANCIAL STATEMENTS AND RELAT
- Page 241 and 242:
2012 FINANCIAL STATEMENTS AND RELAT
- Page 243 and 244:
2012 FINANCIAL STATEMENTS AND RELAT
- Page 245 and 246:
2012 FINANCIAL STATEMENTS AND RELAT
- Page 247 and 248:
SUSTAINABLE DEVELOPMENT AND CORPORA
- Page 249 and 250:
SUSTAINABLE DEVELOPMENT AND CORPORA
- Page 251 and 252:
SUSTAINABLE DEVELOPMENT AND CORPORA
- Page 253 and 254:
SUSTAINABLE DEVELOPMENT AND CORPORA
- Page 255 and 256:
SUSTAINABLE DEVELOPMENT AND CORPORA
- Page 257 and 258:
SUSTAINABLE DEVELOPMENT AND CORPORA
- Page 259 and 260:
SUSTAINABLE DEVELOPMENT AND CORPORA
- Page 261 and 262:
SUSTAINABLE DEVELOPMENT AND CORPORA
- Page 263 and 264:
SUSTAINABLE DEVELOPMENT AND CORPORA
- Page 265 and 266:
SUSTAINABLE DEVELOPMENT AND CORPORA
- Page 267 and 268:
SUSTAINABLE DEVELOPMENT AND CORPORA
- Page 269 and 270:
SUSTAINABLE DEVELOPMENT AND CORPORA
- Page 271 and 272:
COMBINED GENERAL MEETING OF 13 MAY
- Page 273 and 274:
COMBINED GENERAL MEETING8.2. Report
- Page 275 and 276:
COMBINED GENERAL MEETING8.3. Report
- Page 277 and 278:
COMBINED GENERAL MEETINGIn ordinary
- Page 279 and 280:
COMBINED GENERAL MEETING- ensure ad
- Page 281 and 282:
COMBINED GENERAL MEETINGOTHER INFOR
- Page 283 and 284:
OTHER INFORMATION9.4. Person respon
- Page 285 and 286:
OTHER INFORMATION14. ADMINISTRATIVE
- Page 287 and 288:
OTHER INFORMATIONiv.Reports of the
- Page 290:
288 - M6 GROUP - 2012 REGISTRATION