


Create successful ePaper yourself
Turn your PDF publications into a flip-book with our unique Google optimized e-Paper software.
IFTA JOURNAL<br />
2017 EDITION<br />
continuation of the real-time tests of the Wyckoff Method.<br />
In that first article, the spotlight zeroed in on the Law of<br />
Cause and Effect and the Wyckoff Method’s application of the<br />
point-and-figure chart. It concluded with the expectation that<br />
the DJIA would rise from about 8,000 to around 14,400 during<br />
the 2003 primary-trend bull market.<br />
The second article, appearing in the 2008 issue of the IFTA<br />
Journal, reported the successful achievement of the 2004<br />
prediction. In 2007, the market reached within 5% of DJIA<br />
14,400, and the article concluded that the empirical data<br />
generated by the DJIA, in that natural laboratory experiment of<br />
the market, supported the contentions of the Wyckoff Law of<br />
Cause and Effect.<br />
Although no article was published to report on the top<br />
pattern that formed in the DJIA during 2007 and the subsequent<br />
decline into 2009, there nevertheless appeared a study after<br />
the fact. Mr. Brad Brenneise, a Wyckoff student at Golden Gate<br />
University, conducted a back-testing research project on the<br />
2007 top and the subsequent drop to the low in 2009.<br />
Using a point-and-figure chart of the S&P 500, Mr. Brenneise’s<br />
study revealed that a point-and-figure count of the S&P 500 in<br />
2007 gave an accurate forecast of the 2009 price low.<br />
A companion article that fit into this Wyckoff series<br />
appeared in the IFTA Journal in 2010. The article, “Wyckoff<br />
Proofs,” elaborated upon the concept of a “market test” that<br />
has occupied an important role in this series of studies of the<br />
Wyckoff Method. That 2010 article defined and illustrated three<br />
distinct types of Wyckoff Tests: (1) Tests as decision rules, such<br />
as the nine Buying Tests and the nine Selling Tests; (2) Testing as<br />
a phase in a trading range as seen in schematics of accumulation<br />
or distribution, and (3) Secondary tests as witnessed in the<br />
compound procedures of action and then test.<br />
This, the fifth article in the series, harkens back to the<br />
article published in 2009 concerning the major cyclic top then<br />
underway. Like that article, which reported the results of the<br />
2003–2004 prediction of an advance to 14,400, this article is<br />
another study of “what has actually happened.” This article<br />
undertakes an examination of the interim results of the<br />
2008–2009 accumulation base in the Dow Industrial Average,<br />
and emphasis is once again placed on the Wyckoff Law of Cause<br />
and Effect and the point-and-figure price projections for DJIA<br />
17,600–19,200.<br />
Richard D. Wyckoff and His Market<br />
Investment Theory<br />
Richard D. Wyckoff was a titan of technical analysis. A<br />
pioneer in the technical approach to studying the stock market,<br />
Richard Wyckoff was a broker, a trader and a publisher during<br />
the classic era of technical analysis and trading in the early 20th<br />
century.<br />
He codified the best practices of legendary traders, such as<br />
Jesse Livermore, into laws, principles, and techniques of trading<br />
methodology, money management, and mental discipline. Mr.<br />
Wyckoff was dedicated to instructing the public about “the<br />
real rules of the game,” as played by the large interests behind<br />
the scenes. In 1930, he founded a school that later became the<br />
Stock Market Institute. Students of the Wyckoff Method have<br />
repeatedly time-tested his insights and found they are as valid<br />
today as when they were first promulgated.<br />
Wyckoff believed that the action of the market itself was all<br />
that was needed for intelligent, scientific trading and investing.<br />
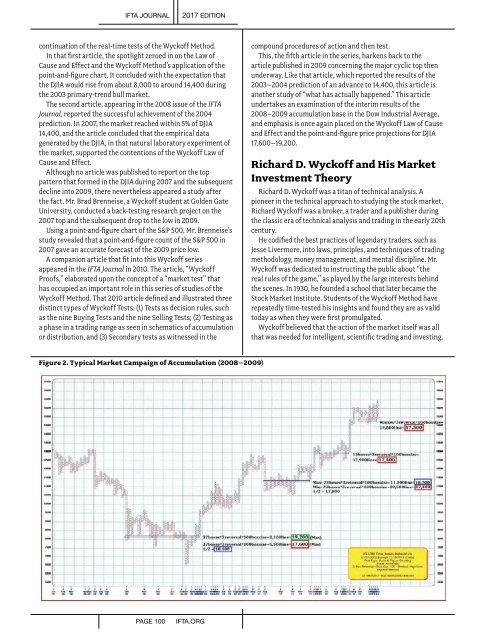
Figure 2. Typical Market Campaign of Accumulation (2008–2009)<br />
PAGE 100<br />
IFTA.ORG