


You also want an ePaper? Increase the reach of your titles
YUMPU automatically turns print PDFs into web optimized ePapers that Google loves.
IFTA JOURNAL<br />
2017 EDITION<br />
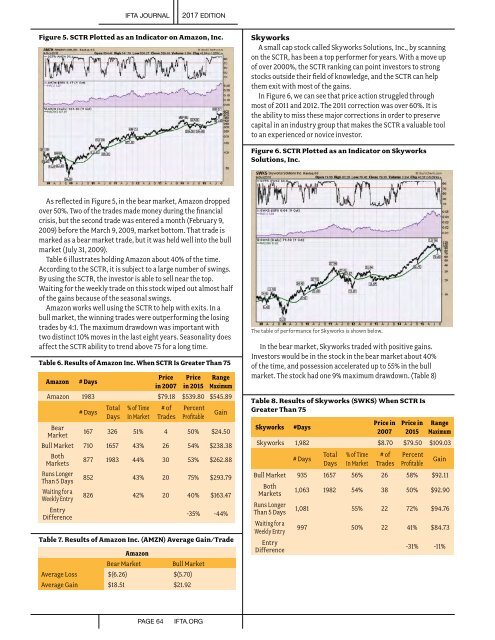
Figure 5. SCTR Plotted as an Indicator on Amazon, Inc.<br />
Skyworks<br />
A small cap stock called Skyworks Solutions, Inc., by scanning<br />
on the SCTR, has been a top performer for years. With a move up<br />
of over 2000%, the SCTR ranking can point investors to strong<br />
stocks outside their field of knowledge, and the SCTR can help<br />
them exit with most of the gains.<br />
In Figure 6, we can see that price action struggled through<br />
most of 2011 and 2012. The 2011 correction was over 60%. It is<br />
the ability to miss these major corrections in order to preserve<br />
capital in an industry group that makes the SCTR a valuable tool<br />
to an experienced or novice investor.<br />
Figure 6. SCTR Plotted as an Indicator on Skyworks<br />
Solutions, Inc.<br />
As reflected in Figure 5, in the bear market, Amazon dropped<br />
over 50%. Two of the trades made money during the financial<br />
crisis, but the second trade was entered a month (February 9,<br />
2009) before the March 9, 2009, market bottom. That trade is<br />
marked as a bear market trade, but it was held well into the bull<br />
market (July 31, 2009).<br />
Table 6 illustrates holding Amazon about 40% of the time.<br />
According to the SCTR, it is subject to a large number of swings.<br />
By using the SCTR, the investor is able to sell near the top.<br />
Waiting for the weekly trade on this stock wiped out almost half<br />
of the gains because of the seasonal swings.<br />
Amazon works well using the SCTR to help with exits. In a<br />
bull market, the winning trades were outperforming the losing<br />
trades by 4:1. The maximum drawdown was important with<br />
two distinct 10% moves in the last eight years. Seasonality does<br />
affect the SCTR ability to trend above 75 for a long time.<br />
Table 6. Results of Amazon Inc. When SCTR Is Greater Than 75<br />
Amazon # Days<br />
Price<br />
in 2007<br />
Price<br />
in 2015<br />
Range<br />
Maximum<br />
Amazon 1983 $79.18 $539.80 $545.89<br />
# Days<br />
Total<br />
Days<br />
% of Time<br />
In Market<br />
# of<br />
Trades<br />
Percent<br />
Profitable<br />
Gain<br />
Bear<br />
Market<br />
167 326 51% 4 50% $24.50<br />
Bull Market 710 1657 43% 26 54% $238.38<br />
Both<br />
Markets<br />
877 1983 44% 30 53% $262.88<br />
Runs Longer<br />
Than 5 Days<br />
852 43% 20 75% $293.79<br />
Waiting for a<br />
Weekly Entry<br />
826 42% 20 40% $163.47<br />
Entry<br />
Difference<br />
-35% -44%<br />
Table 7. Results of Amazon Inc. (AMZN) Average Gain/Trade<br />
Amazon<br />
Bear Market<br />
Bull Market<br />
Average Loss $(6.26) $(5.70)<br />
Average Gain $18.51 $21.92<br />
The table of performance for Skyworks is shown below.<br />
In the bear market, Skyworks traded with positive gains.<br />
Investors would be in the stock in the bear market about 40%<br />
of the time, and possession accelerated up to 55% in the bull<br />
market. The stock had one 9% maximum drawdown. (Table 8)<br />
Table 8. Results of Skyworks (SWKS) When SCTR Is<br />
Greater Than 75<br />
Skyworks<br />
#Days<br />
Price in<br />
2007<br />
Price in<br />
2015<br />
Range<br />
Maximum<br />
Skyworks 1,982 $8.70 $79.50 $109.03<br />
# Days<br />
Total<br />
Days<br />
% of Time<br />
In Market<br />
# of<br />
Trades<br />
Percent<br />
Profitable<br />
Gain<br />
Bull Market 935 1657 56% 26 58% $92.11<br />
Both<br />
Markets<br />
Runs Longer<br />
Than 5 Days<br />
Waiting for a<br />
Weekly Entry<br />
Entry<br />
Difference<br />
1,063 1982 54% 38 50% $92.90<br />
1,081 55% 22 72% $94.76<br />
997 50% 22 41% $84.73<br />
-31% -11%<br />
PAGE 64<br />
IFTA.ORG