


You also want an ePaper? Increase the reach of your titles
YUMPU automatically turns print PDFs into web optimized ePapers that Google loves.
IFTA JOURNAL<br />
2017 EDITION<br />
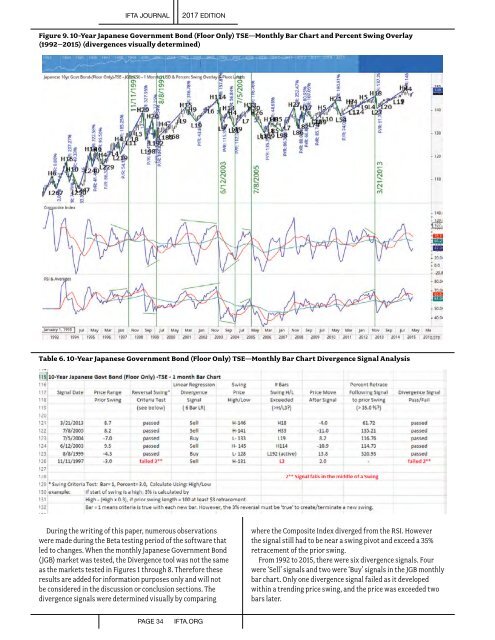
Figure 9. 10-Year Japanese Government Bond (Floor Only) TSE—Monthly Bar Chart and Percent Swing Overlay<br />
(1992–2015) (divergences visually determined)<br />
Table 6. 10-Year Japanese Government Bond (Floor Only) TSE—Monthly Bar Chart Divergence Signal Analysis<br />
During the writing of this paper, numerous observations<br />
were made during the Beta testing period of the software that<br />
led to changes. When the monthly Japanese Government Bond<br />
(JGB) market was tested, the Divergence tool was not the same<br />
as the markets tested in Figures 1 through 8. Therefore these<br />
results are added for information purposes only and will not<br />
be considered in the discussion or conclusion sections. The<br />
divergence signals were determined visually by comparing<br />
where the Composite Index diverged from the RSI. However<br />
the signal still had to be near a swing pivot and exceed a 35%<br />
retracement of the prior swing.<br />
From 1992 to 2015, there were six divergence signals. Four<br />
were ‘Sell’ signals and two were ‘Buy’ signals in the JGB monthly<br />
bar chart. Only one divergence signal failed as it developed<br />
within a trending price swing, and the price was exceeded two<br />
bars later.<br />
PAGE 34<br />
IFTA.ORG