


You also want an ePaper? Increase the reach of your titles
YUMPU automatically turns print PDFs into web optimized ePapers that Google loves.
IFTA JOURNAL<br />
2017 EDITION<br />
W.D. Gann also used overlays with angles every 60 degrees,<br />
like the examples in Figures 19 and 20.<br />
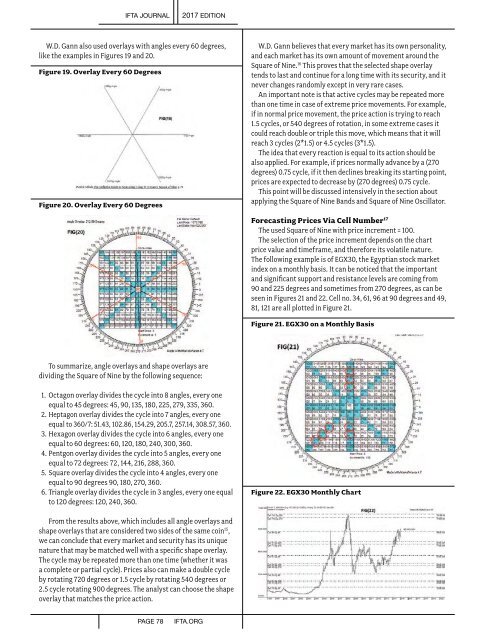
Figure 19. Overlay Every 60 Degrees<br />
Figure 20. Overlay Every 60 Degrees<br />
W.D. Gann believes that every market has its own personality,<br />
and each market has its own amount of movement around the<br />
Square of Nine. 16 This proves that the selected shape overlay<br />
tends to last and continue for a long time with its security, and it<br />
never changes randomly except in very rare cases.<br />
An important note is that active cycles may be repeated more<br />
than one time in case of extreme price movements. For example,<br />
if in normal price movement, the price action is trying to reach<br />
1.5 cycles, or 540 degrees of rotation, in some extreme cases it<br />
could reach double or triple this move, which means that it will<br />
reach 3 cycles (2*1.5) or 4.5 cycles (3*1.5).<br />
The idea that every reaction is equal to its action should be<br />
also applied. For example, if prices normally advance by a (270<br />
degrees) 0.75 cycle, if it then declines breaking its starting point,<br />
prices are expected to decrease by (270 degrees) 0.75 cycle.<br />
This point will be discussed intensively in the section about<br />
applying the Square of Nine Bands and Square of Nine Oscillator.<br />
Forecasting Prices Via Cell Number 17 <br />
The used Square of Nine with price increment = 100.<br />
The selection of the price increment depends on the chart<br />
price value and timeframe, and therefore its volatile nature.<br />
The following example is of EGX30, the Egyptian stock market<br />
index on a monthly basis.It can be noticed that the important<br />
and significant support and resistance levels are coming from<br />
90 and 225 degrees and sometimes from 270 degrees, as can be<br />
seen in Figures 21 and 22. Cell no. 34, 61, 96 at 90 degrees and 49,<br />
81, 121 are all plotted in Figure 21.<br />
Figure 21. EGX30 on a Monthly Basis<br />
To summarize, angle overlays and shape overlays are<br />
dividing the Square of Nine by the following sequence:<br />
1. Octagon overlay divides the cycle into 8 angles, every one<br />
equal to 45 degrees: 45, 90, 135, 180, 225, 279, 335, 360. <br />
2. Heptagon overlay divides the cycle into 7 angles, every one<br />
equal to 360/7: 51.43, 102.86, 154.29, 205.7, 257.14, 308.57, 360. <br />
3. Hexagon overlay divides the cycle into 6 angles, every one<br />
equal to 60 degrees: 60, 120, 180, 240, 300, 360. <br />
4. Pentgon overlay divides the cycle into 5 angles, every one<br />
equal to 72 degrees: 72, 144, 216, 288, 360. <br />
5. Square overlay divides the cycle into 4 angles, every one<br />
equal to 90 degrees 90, 180, 270, 360. <br />
6. Triangle overlay divides the cycle in 3 angles, every one equal<br />
to 120 degrees: 120, 240, 360. <br />
Figure 22. EGX30 Monthly Chart<br />
From the results above, which includes all angle overlays and<br />
shape overlays that are considered two sides of the same coin 15 ,<br />
we can conclude that every market and security has its unique<br />
nature that may be matched well with a specific shape overlay.<br />
The cycle may be repeated more than one time (whether it was<br />
a complete or partial cycle). Prices also can make a double cycle<br />
by rotating 720 degrees or 1.5 cycle by rotating 540 degrees or<br />
2.5 cycle rotating 900 degrees. The analyst can choose the shape<br />
overlay that matches the price action.<br />
PAGE 78<br />
IFTA.ORG