


Create successful ePaper yourself
Turn your PDF publications into a flip-book with our unique Google optimized e-Paper software.
IFTA JOURNAL<br />
2017 EDITION<br />
The Significance of the 400-Day Moving Average as a<br />
Sell Signal as Compared to Other Moving Averages<br />
By Jordan Roy-Byrne, CMT, MFTA<br />
Jordan Roy-Byrne, CMT, MFTA<br />
Jordan@TheDailyGold.com<br />
5101 25 th Ave NE, #C135<br />
Seattle, WA 98105<br />
(206) 973-7843<br />
Abstract<br />
This paper compares the efficacy and viability of four moving<br />
averages as sell signals. Using monthly equivalents (10-month<br />
moving average for the 200-day moving average and 20-month<br />
moving average for the 400-day moving average) we compiled<br />
data as to how a market performed after it closed below those<br />
monthly moving averages. We specifically recorded how far<br />
the market declined from the break of the moving average<br />
to its next low. We recorded all instances and summarized<br />
our findings with an average decline and median decline. We<br />
applied this study to eight different markets: S&P 500, Emerging<br />
Markets, Nasdaq, Nikkei Hong Kong, Commodities (CCI), Gold<br />
and Oil. The results as to which moving averages produced the<br />
best sell signals varied between markets and asset classes.<br />
However, for the entire study, the 20-month and 30-month<br />
moving average sell signals produced the best results. The<br />
20-month moving average sell signal was best for the S&P 500<br />
and Emerging Markets. The 10-month moving average and<br />
median sell signal (proxy for 200-day moving average) shows<br />
very little viability and efficacy in comparison to the longer<br />
period moving averages.<br />
Introduction<br />
The study of moving averages is a key component of technical<br />
analysis. Both novice and professional practitioners of technical<br />
analysis use a variety of and combination of moving averages in<br />
their trading and investing. Advanced practitioners will often<br />
use a combination of exponential (recent data weighted more<br />
heavily) moving averages and simple (all data weighted equally)<br />
moving averages. Basic moving average analysis starts with the<br />
simple 50- and 200-day moving averages.<br />
Conventional wisdom is that the 200-day moving average is<br />
the most important moving average. It is a huge focus of basic<br />
moving average analysis and is always discussed publicly when<br />
the stock market starts to roll over. Famed trader and fund<br />
manager Paul Tudor Jones spoke about this in a rare interview<br />
over 15 years ago:<br />
My metric for everything I look at is the 200-day<br />
moving average of closing prices. I’ve seen too many<br />
things go to zero, stocks and commodities. The whole<br />
trick in investing is: “How do I keep from losing<br />
everything?” If you use the 200-day moving average<br />
rule, then you get out. You play defense and you get out.<br />
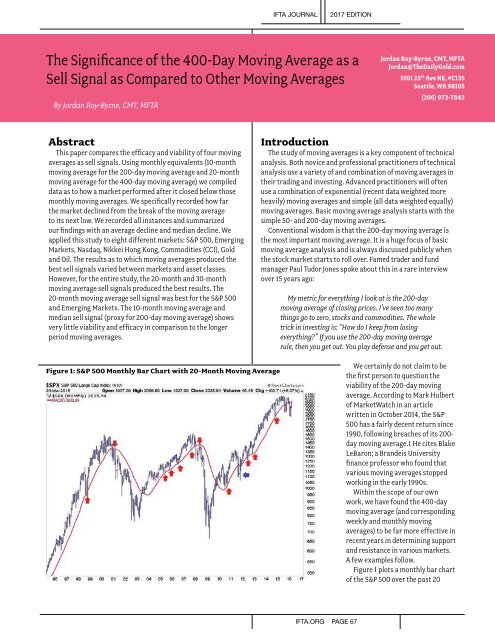
Figure 1: S&P 500 Monthly Bar Chart with 20-Month Moving Average<br />
We certainly do not claim to be<br />
the first person to question the<br />
viability of the 200-day moving<br />
average. According to Mark Hulbert<br />
of MarketWatch in an article<br />
written in October 2014, the S&P<br />
500 has a fairly decent return since<br />
1990, following breaches of its 200-<br />
day moving average.1 He cites Blake<br />
LeBaron; a Brandeis University<br />
finance professor who found that<br />
various moving averages stopped<br />
working in the early 1990s.<br />
Within the scope of our own<br />
work, we have found the 400-day<br />
moving average (and corresponding<br />
weekly and monthly moving<br />
averages) to be far more effective in<br />
recent years in determining support<br />
and resistance in various markets.<br />
A few examples follow.<br />
Figure 1 plots a monthly bar chart<br />
of the S&P 500 over the past 20<br />
IFTA.ORG PAGE 67