


Create successful ePaper yourself
Turn your PDF publications into a flip-book with our unique Google optimized e-Paper software.
IFTA JOURNAL<br />
2017 EDITION<br />
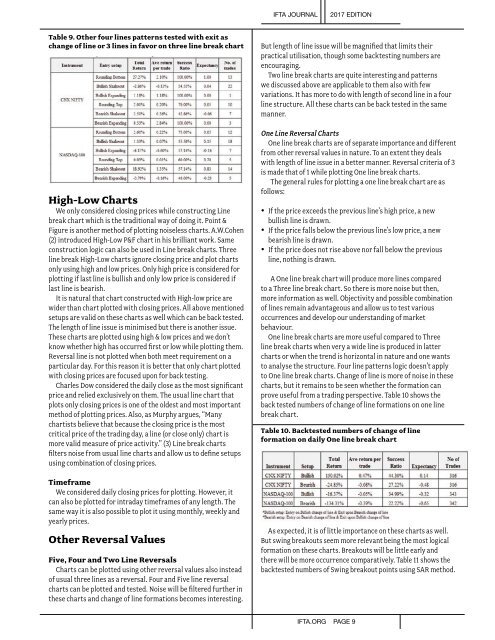
Table 9. Other four lines patterns tested with exit as<br />
change of line or 3 lines in favor on three line break chart<br />
High-Low Charts<br />
We only considered closing prices while constructing Line<br />
break chart which is the traditional way of doing it. Point &<br />
Figure is another method of plotting noiseless charts. A.W.Cohen<br />
(2) introduced High-Low P&F chart in his brilliant work. Same<br />
construction logic can also be used in Line break charts. Three<br />
line break High-Low charts ignore closing price and plot charts<br />
only using high and low prices. Only high price is considered for<br />
plotting if last line is bullish and only low price is considered if<br />
last line is bearish.<br />
It is natural that chart constructed with High-low price are<br />
wider than chart plotted with closing prices. All above mentioned<br />
setups are valid on these charts as well which can be back tested.<br />
The length of line issue is minimised but there is another issue.<br />
These charts are plotted using high & low prices and we don’t<br />
know whether high has occurred first or low while plotting them.<br />
Reversal line is not plotted when both meet requirement on a<br />
particular day. For this reason it is better that only chart plotted<br />
with closing prices are focused upon for back testing.<br />
Charles Dow considered the daily close as the most significant<br />
price and relied exclusively on them. The usual line chart that<br />
plots only closing prices is one of the oldest and most important<br />
method of plotting prices. Also, as Murphy argues, “Many<br />
chartists believe that because the closing price is the most<br />
critical price of the trading day, a line (or close only) chart is<br />
more valid measure of price activity.” (3) Line break charts<br />
filters noise from usual line charts and allow us to define setups<br />
using combination of closing prices.<br />
Timeframe<br />
We considered daily closing prices for plotting. However, it<br />
can also be plotted for intraday timeframes of any length. The<br />
same way it is also possible to plot it using monthly, weekly and<br />
yearly prices.<br />
Other Reversal Values<br />
Five, Four and Two Line Reversals<br />
Charts can be plotted using other reversal values also instead<br />
of usual three lines as a reversal. Four and Five line reversal<br />
charts can be plotted and tested. Noise will be filtered further in<br />
these charts and change of line formations becomes interesting.<br />
But length of line issue will be magnified that limits their<br />
practical utilisation, though some backtesting numbers are<br />
encouraging.<br />
Two line break charts are quite interesting and patterns<br />
we discussed above are applicable to them also with few<br />
variations. It has more to do with length of second line in a four<br />
line structure. All these charts can be back tested in the same<br />
manner.<br />
One Line Reversal Charts<br />
One line break charts are of separate importance and different<br />
from other reversal values in nature. To an extent they deals<br />
with length of line issue in a better manner. Reversal criteria of 3<br />
is made that of 1 while plotting One line break charts.<br />
The general rules for plotting a one line break chart are as<br />
follows:<br />
• If the price exceeds the previous line’s high price, a new<br />
bullish line is drawn.<br />
• If the price falls below the previous line’s low price, a new<br />
bearish line is drawn.<br />
• If the price does not rise above nor fall below the previous<br />
line, nothing is drawn.<br />
A One line break chart will produce more lines compared<br />
to a Three line break chart. So there is more noise but then,<br />
more information as well. Objectivity and possible combination<br />
of lines remain advantageous and allow us to test various<br />
occurrences and develop our understanding of market<br />
behaviour.<br />
One line break charts are more useful compared to Three<br />
line break charts when very a wide line is produced in latter<br />
charts or when the trend is horizontal in nature and one wants<br />
to analyse the structure. Four line patterns logic doesn’t apply<br />
to One line break charts. Change of line is more of noise in these<br />
charts, but it remains to be seen whether the formation can<br />
prove useful from a trading perspective. Table 10 shows the<br />
back tested numbers of change of line formations on one line<br />
break chart.<br />
Table 10. Backtested numbers of change of line<br />
formation on daily One line break chart<br />
As expected, it is of little importance on these charts as well.<br />
But swing breakouts seem more relevant being the most logical<br />
formation on these charts. Breakouts will be little early and<br />
there will be more occurrence comparatively. Table 11 shows the<br />
backtested numbers of Swing breakout points using SAR method.<br />
IFTA.ORG PAGE 9