


Create successful ePaper yourself
Turn your PDF publications into a flip-book with our unique Google optimized e-Paper software.
IFTA JOURNAL<br />
2017 EDITION<br />
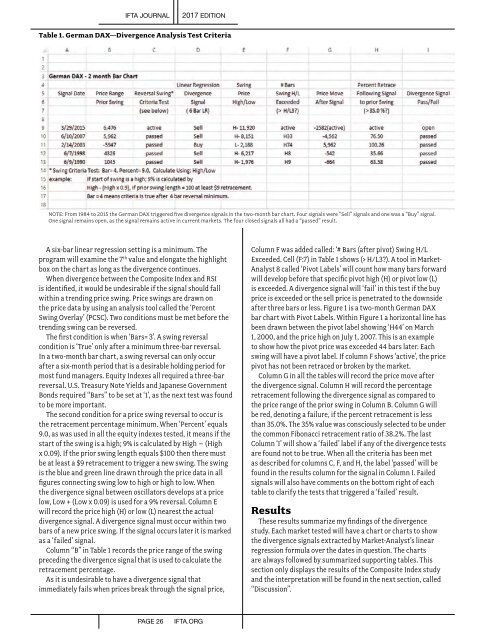
Table 1. German DAX—Divergence Analysis Test Criteria<br />
NOTE: From 1984 to 2015 the German DAX triggered five divergence signals in the two-month bar chart. Four signals were “Sell” signals and one was a “Buy” signal.<br />
One signal remains open, as the signal remains active in current markets. The four closed signals all had a “passed” result.<br />
A six-bar linear regression setting is a minimum. The<br />
program will examine the 7 th value and elongate the highlight<br />
box on the chart as long as the divergence continues.<br />
When divergence between the Composite Index and RSI<br />
is identified, it would be undesirable if the signal should fall<br />
within a trending price swing. Price swings are drawn on<br />
the price data by using an analysis tool called the ‘Percent<br />
Swing Overlay’ (PCSC). Two conditions must be met before the<br />
trending swing can be reversed.<br />
The first condition is when ‘Bars= 3’. A swing reversal<br />
condition is ‘True’ only after a minimum three-bar reversal.<br />
In a two-month bar chart, a swing reversal can only occur<br />
after a six-month period that is a desirable holding period for<br />
most fund managers. Equity Indexes all required a three-bar<br />
reversal. U.S. Treasury Note Yields and Japanese Government<br />
Bonds required “Bars” to be set at ‘1’, as the next test was found<br />
to be more important.<br />
The second condition for a price swing reversal to occur is<br />
the retracement percentage minimum. When ‘Percent’ equals<br />
9.0, as was used in all the equity indexes tested, it means if the<br />
start of the swing is a high; 9% is calculated by High – (High<br />
x 0.09). If the prior swing length equals $100 then there must<br />
be at least a $9 retracement to trigger a new swing. The swing<br />
is the blue and green line drawn through the price data in all<br />
figures connecting swing low to high or high to low. When<br />
the divergence signal between oscillators develops at a price<br />
low, Low + (Low x 0.09) is used for a 9% reversal. Column E<br />
will record the price high (H) or low (L) nearest the actual<br />
divergence signal. A divergence signal must occur within two<br />
bars of a new price swing. If the signal occurs later it is marked<br />
as a ‘failed’ signal.<br />
Column “B” in Table 1 records the price range of the swing<br />
preceding the divergence signal that is used to calculate the<br />
retracement percentage.<br />
As it is undesirable to have a divergence signal that<br />
immediately fails when prices break through the signal price,<br />
Column F was added called: ‘# Bars (after pivot) Swing H/L<br />
Exceeded. Cell (F:7) in Table 1 shows (> H/L3?). A tool in Market-<br />
Analyst 8 called ‘Pivot Labels’ will count how many bars forward<br />
will develop before that specific pivot high (H) or pivot low (L)<br />
is exceeded. A divergence signal will ‘fail’ in this test if the buy<br />
price is exceeded or the sell price is penetrated to the downside<br />
after three bars or less. Figure 1 is a two-month German DAX<br />
bar chart with Pivot Labels. Within Figure 1 a horizontal line has<br />
been drawn between the pivot label showing ‘H44’ on March<br />
1, 2000, and the price high on July 1, 2007. This is an example<br />
to show how the pivot price was exceeded 44 bars later. Each<br />
swing will have a pivot label. If column F shows ‘active’, the price<br />
pivot has not been retraced or broken by the market.<br />
Column G in all the tables will record the price move after<br />
the divergence signal. Column H will record the percentage<br />
retracement following the divergence signal as compared to<br />
the price range of the prior swing in Column B. Column G will<br />
be red, denoting a failure, if the percent retracement is less<br />
than 35.0%. The 35% value was consciously selected to be under<br />
the common Fibonacci retracement ratio of 38.2%. The last<br />
Column ‘I’ will show a ‘failed’ label if any of the divergence tests<br />
are found not to be true. When all the criteria has been met<br />
as described for columns C, F, and H, the label ‘passed’ will be<br />
found in the results column for the signal in Column I. Failed<br />
signals will also have comments on the bottom right of each<br />
table to clarify the tests that triggered a ‘failed’ result.<br />
Results<br />
These results summarize my findings of the divergence<br />
study. Each market tested will have a chart or charts to show<br />
the divergence signals extracted by Market-Analyst’s linear<br />
regression formula over the dates in question. The charts<br />
are always followed by summarized supporting tables. This<br />
section only displays the results of the Composite Index study<br />
and the interpretation will be found in the next section, called<br />
“Discussion”.<br />
PAGE 26<br />
IFTA.ORG