


You also want an ePaper? Increase the reach of your titles
YUMPU automatically turns print PDFs into web optimized ePapers that Google loves.
IFTA JOURNAL<br />
2017 EDITION<br />
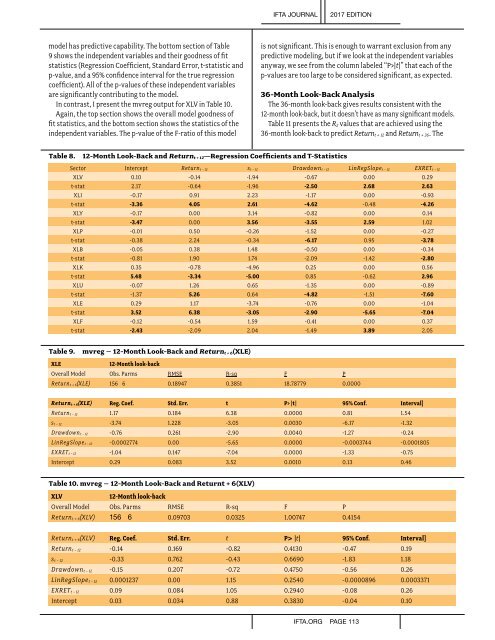
model has predictive capability. The bottom section of Table<br />
9 shows the independent variables and their goodness of fit<br />
statistics (Regression Coefficient, Standard Error, t-statistic and<br />
p-value, and a 95% confidence interval for the true regression<br />
coefficient). All of the p-values of these independent variables<br />
are significantly contributing to the model.<br />
In contrast, I present the mvreg output for XLV in Table 10.<br />
Again, the top section shows the overall model goodness of<br />
fit statistics, and the bottom section shows the statistics of the<br />
independent variables. The p-value of the F-ratio of this model<br />
is not significant. This is enough to warrant exclusion from any<br />
predictive modeling, but if we look at the independent variables<br />
anyway, we see from the column labeled “P>|t|” that each of the<br />
p-values are too large to be considered significant, as expected.<br />
36-Month Look-Back Analysis<br />
The 36-month look-back gives results consistent with the<br />
12-month look-back, but it doesn’t have as many significant models.<br />
Table 11 presents the R 2 values that are achieved using the<br />
36-month look-back to predict Return t + 12 and Return t + 36 . The<br />
Table 8.<br />
12-Month Look-Back and Return t + 12—Regression Coefficients and T-Statistics<br />
Sector Intercept Return t − 12 s t − 12 Drawdown t − 12 LinRegSlope t − 12 EXRET t − 12<br />
XLV 0.10 -0.14 -1.94 -0.67 0.00 0.29<br />
t-stat 2.17 -0.64 -1.96 -2.50 2.68 2.63<br />
XLI -0.17 0.91 2.23 -1.17 0.00 -0.93<br />
t-stat -3.36 4.05 2.61 -4.62 -0.48 -4.26<br />
XLY -0.17 0.00 3.14 -0.82 0.00 0.14<br />
t-stat -3.47 0.00 3.56 -3.55 2.59 1.02<br />
XLP -0.01 0.50 -0.26 -1.52 0.00 -0.27<br />
t-stat -0.38 2.24 -0.34 -6.17 0.95 -3.78<br />
XLB -0.05 0.38 1.48 -0.50 0.00 -0.34<br />
t-stat -0.81 1.90 1.74 -2.09 -1.42 -2.80<br />
XLK 0.35 -0.78 -4.96 0.25 0.00 0.56<br />
t-stat 5.48 -3.34 -5.00 0.85 -0.62 2.96<br />
XLU -0.07 1.26 0.65 -1.35 0.00 -0.89<br />
t-stat -1.37 5.26 0.64 -4.82 -1.51 -7.60<br />
XLE 0.29 1.17 -3.74 -0.76 0.00 -1.04<br />
t-stat 3.52 6.38 -3.05 -2.90 -5.65 -7.04<br />
XLF -0.12 -0.54 1.59 -0.41 0.00 0.37<br />
t-stat -2.43 -2.09 2.04 -1.49 3.89 2.05<br />
Table 9.<br />
mvreg – 12-Month Look-Back and Return t + 6(XLE)<br />
XLE<br />
12-Month look-back<br />
Overall Model Obs. Parms RMSE R-sq F P<br />
Return t + 6(XLE) 156 6 0.18947 0.3851 18.78779 0.0000<br />
Return t + 6(XLE) Reg. Coef. Std. Err. t P> |t| 95% Conf. Interval]<br />
Return t − 12 1.17 0.184 6.38 0.0000 0.81 1.54<br />
s t − 12 -3.74 1.228 -3.05 0.0030 -6.17 -1.32<br />
Drawdown t − 12 -0.76 0.261 -2.90 0.0040 -1.27 -0.24<br />
LinRegSlope t − 12 -0.0002774 0.00 -5.65 0.0000 -0.0003744 -0.0001805<br />
EXRET t − 12 -1.04 0.147 -7.04 0.0000 -1.33 -0.75<br />
Intercept 0.29 0.083 3.52 0.0010 0.13 0.46<br />
Table 10. mvreg – 12-Month Look-Back and Returnt + 6(XLV)<br />
XLV<br />
12-Month look-back<br />
Overall Model Obs. Parms RMSE R-sq F P<br />
Return t + 6(XLV) 156 6 0.09703 0.0325 1.00747 0.4154<br />
Return t + 6(XLV) Reg. Coef. Std. Err. t P> |t| 95% Conf. Interval]<br />
Return t − 12 -0.14 0.169 -0.82 0.4130 -0.47 0.19<br />
s t − 12 -0.33 0.762 -0.43 0.6690 -1.83 1.18<br />
Drawdown t − 12 -0.15 0.207 -0.72 0.4750 -0.56 0.26<br />
LinRegSlope t − 12 0.0001237 0.00 1.15 0.2540 -0.0000896 0.0003371<br />
EXRET t − 12 0.09 0.084 1.05 0.2940 -0.08 0.26<br />
Intercept 0.03 0.034 0.88 0.3830 -0.04 0.10<br />
IFTA.ORG PAGE 113