


Create successful ePaper yourself
Turn your PDF publications into a flip-book with our unique Google optimized e-Paper software.
IFTA JOURNAL<br />
2017 EDITION<br />
Wrestling With a Grizzly Bear: An Argument<br />
Against Pure Buy and Hold Investing<br />
By David M. Tonaszuck, CMT, MFTA<br />
David Tonaszuck<br />
David.Tonaszuck@lpl.com<br />
LPL Financial, LLC<br />
75 State Street<br />
Boston, MA 02110<br />
(617) 897-4288<br />
Abstract<br />
This paper investigated the feasibility of using a trend-trading<br />
model on U.S. equities over the time period of 1929–2009 to<br />
manage risk and aid in investment decisions. To do so, three<br />
secular bear and two secular bull markets were analyzed, and<br />
a strategy, based on a weekly Relative Strength Index (RSI)<br />
indicator, is applied.<br />
The backtest results provide evidence that using the RSI<br />
(14) indicator as a trend-trading strategy helps accomplish the<br />
following: 1) Generates profits in excess of a simple buy and hold<br />
strategy during a secular bear market; 2) Reduces downside risk<br />
versus buy and hold caused by bear market cyclical drawdown<br />
periods; and 3) Underperforms buy and hold during a secular<br />
bull market.<br />
Introduction<br />
The strategy used in this study consists of two moving<br />
averages of the RSI, and the usual crossover rules are<br />
applied. A long indication from the indicator translates into a<br />
position consisting of a total investment. A short indication<br />
is interpreted as a period where no investments are held. The<br />
results are compared to a buy and hold strategy.<br />
The research herein has provided an argument against pure<br />
buy and hold investing, especially during a secular bear market.<br />
Historically, buy and hold tends to merely produce the flat-tolower<br />
returns associated with the overall markets during these<br />
turbulent time periods. Employing a buy and hold strategy<br />
during a secular bear market is like wrestling with a grizzly<br />
bear; it can be potentially lethal, especially to a portfolio.<br />
Trend Trading in Bull and Bear<br />
Markets<br />
Technical analysts have relied on the assumption that there<br />
lies the ability to predict market returns by identifying patterns<br />
and characteristics of past stock market prices. One method<br />
of identifying price patterns is by understanding the price<br />
trend within various “bull” and “bear” markets and applying<br />
a technical trend-trading strategy for buy and sell decisions.<br />
Historically, trend-trading strategies have been applied to<br />
commodities, futures, and currency markets; they seek to enter<br />
the market in the direction of an existing trend and to exit when<br />
the trend reverses. 1 Over the past decade, limited research has<br />
been published regarding trend-trading strategies as applied<br />
to U.S. equities markets. In their book The Ivy Portfolio: How to<br />
Invest Like the Top Endowments and Avoid Bear Markets, Faber<br />
and Richardson provide evidence that a moving average–based,<br />
trend-trading strategy applied within U.S. equities can generate<br />
profitable outcomes. 2<br />
Most investors associate the application of a trend-trading<br />
strategy to take advantage of price momentum generated in a bull<br />
market; however, another important application of trend trading is<br />
the protection of assets during a painful bear market drawdown.<br />
Secular Market Trends<br />
According to Martin Pring, 3 a secular trend is a long-term trend<br />
constructed from a number of primary or cyclical trends and<br />
secondary trends. A secular trend typically lasts 10 to 25 years in<br />
duration. For example, a secular bear market comprises smaller<br />
magnitude bull markets and larger bear markets, and a secular bull<br />
market comprises larger bull markets and smaller bear markets.<br />
For the purposes of this paper the following terms are<br />
further clarified: Bull and bear markets are defined as upward<br />
and downward market trends, respectively. Using technical<br />
analysis, a bull market can be represented on a line chart as<br />
the price generally moving higher, exhibiting characteristics of<br />
higher-highs and higher-lows. Conversely, a bear market can be<br />
represented directionally as the price generally moving lower<br />
(and in some cases sideways), exhibiting characteristics of<br />
lower-highs and lower-lows.<br />
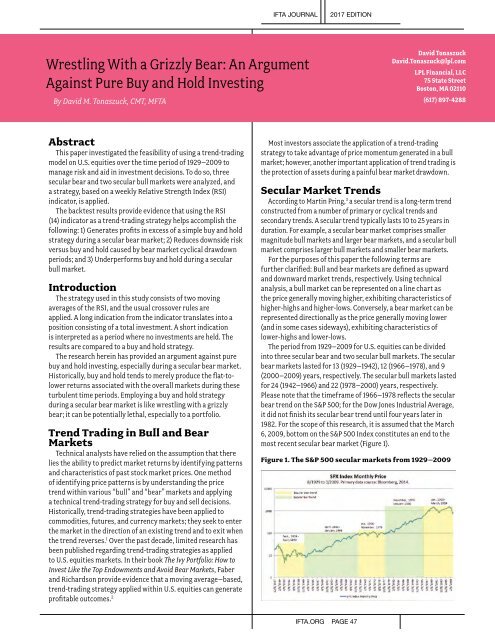
The period from 1929–2009 for U.S. equities can be divided<br />
into three secular bear and two secular bull markets. The secular<br />
bear markets lasted for 13 (1929–1942), 12 (1966–1978), and 9<br />
(2000–2009) years, respectively. The secular bull markets lasted<br />
for 24 (1942–1966) and 22 (1978–2000) years, respectively.<br />
Please note that the timeframe of 1966–1978 reflects the secular<br />
bear trend on the S&P 500; for the Dow Jones Industrial Average,<br />
it did not finish its secular bear trend until four years later in<br />
1982. For the scope of this research, it is assumed that the March<br />
6, 2009, bottom on the S&P 500 Index constitutes an end to the<br />
most recent secular bear market (Figure 1).<br />
Figure 1. The S&P 500 secular markets from 1929–2009<br />
IFTA.ORG PAGE 47