


Create successful ePaper yourself
Turn your PDF publications into a flip-book with our unique Google optimized e-Paper software.
IFTA JOURNAL<br />
2017 EDITION<br />
Table 2. Results of Hasbro, Inc. (HAS) When SCTR Is<br />
Greater Than 75<br />
Price<br />
in 2007<br />
Price<br />
in 2015<br />
Range<br />
Maximum<br />
Hasbro # Days<br />
Hasbro 1,977 $21.73 $74.44 $66.80<br />
# Days<br />
Total<br />
Days<br />
% of<br />
Time in<br />
Market<br />
# of<br />
Trades<br />
Percent<br />
Profitable<br />
Cumulative<br />
Gain<br />
Bear Market 202 320 63% 13 62% $3.87<br />
Bull Market 442 1657 27% 33 45% $21.55<br />
Both<br />
Markets<br />
644 1977 33% 46 50% $25.42<br />
Runs Longer<br />
Than 5 Days<br />
566 10 80% $29.86<br />
Waiting for a<br />
Weekly Entry<br />
526 10 60% $22.95<br />
Entry<br />
Difference<br />
-20% -23%<br />
The Average Gain for Hasbro depending on the primary trend is<br />
shown in Table 3.<br />
Table 3. Results of Hasbro, Inc. (HAS) Average Gain/Trade<br />
Hasbro Bear Market Bull Market<br />
Average Loss $(0.52) $(0.65)<br />
Average Gain $0.88 $2.22<br />
Apple, Inc.<br />
Apple is a well-known name of which most technicians can<br />
visualize the chart pattern almost intuitively. By choosing Apple<br />
to test the SCTR trading system, this may enable a stronger<br />
understanding between the stock knowledge and the SCTR<br />
behavior. The stock suffered major downtrends in 2008, 2012<br />
and 2015. Once again, we only want to own the stock when it is<br />
above the SCTR 75 level. (Figure 4)<br />
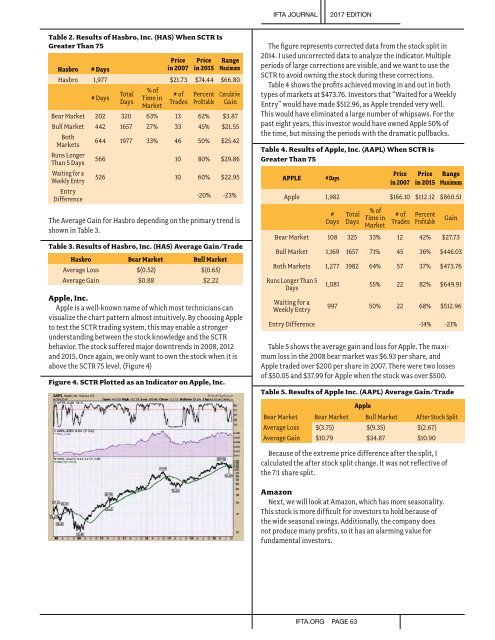
Figure 4. SCTR Plotted as an Indicator on Apple, Inc.<br />
The figure represents corrected data from the stock split in<br />
2014. I used uncorrected data to analyze the indicator. Multiple<br />
periods of large corrections are visible, and we want to use the<br />
SCTR to avoid owning the stock during these corrections.<br />
Table 4 shows the profits achieved moving in and out in both<br />
types of markets at $473.76. Investors that “Waited for a Weekly<br />
Entry” would have made $512.96, as Apple trended very well.<br />
This would have eliminated a large number of whipsaws. For the<br />
past eight years, this investor would have owned Apple 50% of<br />
the time, but missing the periods with the dramatic pullbacks.<br />
Table 4. Results of Apple, Inc. (AAPL) When SCTR Is<br />
Greater Than 75<br />
APPLE # Days<br />
Price<br />
in 2007<br />
Price<br />
in 2015<br />
Range<br />
Maximum<br />
Apple 1,982 $166.10 $112.12 $860.51<br />
#<br />
Days<br />
Total<br />
Days<br />
% of<br />
Time in<br />
Market<br />
# of<br />
Trades<br />
Percent<br />
Profitable<br />
Gain<br />
Bear Market 108 325 33% 12 42% $27.73<br />
Bull Market 1,169 1657 71% 45 36% $446.03<br />
Both Markets 1,277 1982 64% 57 37% $473.76<br />
Runs Longer Than 5<br />
Days<br />
Waiting for a<br />
Weekly Entry<br />
1,081 55% 22 82% $649.91<br />
997 50% 22 68% $512.96<br />
Entry Difference -14% -21%<br />
Table 5 shows the average gain and loss for Apple. The maximum<br />
loss in the 2008 bear market was $6.93 per share, and<br />
Apple traded over $200 per share in 2007. There were two losses<br />
of $50.05 and $37.99 for Apple when the stock was over $500.<br />
Table 5. Results of Apple Inc. (AAPL) Average Gain/Trade<br />
Apple<br />
Bear Market Bear Market Bull Market After Stock Split<br />
Average Loss $(3.75) $(9.35) $(2.67)<br />
Average Gain $10.79 $34.87 $10.90<br />
Because of the extreme price difference after the split, I<br />
calculated the after stock split change. It was not reflective of<br />
the 7:1 share split.<br />
Amazon<br />
Next, we will look at Amazon, which has more seasonality.<br />
This stock is more difficult for investors to hold because of<br />
the wide seasonal swings. Additionally, the company does<br />
not produce many profits, so it has an alarming value for<br />
fundamental investors.<br />
IFTA.ORG PAGE 63