


Create successful ePaper yourself
Turn your PDF publications into a flip-book with our unique Google optimized e-Paper software.
IFTA JOURNAL<br />
2017 EDITION<br />
Research Objective<br />
The objective of this paper is therefore to examine the<br />
efficacy of using the RSI (14) as a trend trading indicator that<br />
could be used in a systematic way to improve profits and<br />
reduce risk compared with pure buy and hold, by reducing the<br />
portfolio’s exposure to the market during more turbulent and<br />
volatile bear market periods.<br />
Materials and Methods<br />
Methodology for RSI (14) Trend-Trading Identifier<br />
Backtest<br />
To test the hypothesis that the RSI (14) can be utilized as a<br />
trend-trading indicator, and whether its readings provide an<br />
investment approach that increases profitability and reduces<br />
risk, the strategy is backtested against the S&P 500 Index—the<br />
U.S. stock market index of the 500 leading companies by market<br />
capitalization.<br />
The following criteria allow this model to be simple, yet<br />
emotion-free and objective.<br />
1. The model uses purely mathematical logic. <br />
2. The same model and parameters can be used for various time<br />
periods (e.g., minute, daily, weekly, monthly) based on the<br />
user’s time horizon. <br />
The RSI (14) trend-trading methodology includes the<br />
following:<br />
Initial Entry<br />
BUY RULE: Enter long when the RSI (14) line closes above the<br />
9-period SMA and above the 45-period EMA.<br />
SELL RULE: Enter cash when the RSI (14) closes below the<br />
9-period RSI (14) SMA and below the 45-period RSI (14) EMA.<br />
Ongoing<br />
A. If long, enter cash when the RSI (14) closes below both the<br />
9-period SMA and 45-period EMA.<br />
B. If cash, enter long when the RSI (14) closes above both the<br />
9-period SMA and 45-period EMA.<br />
Additional rules:<br />
• For the purposes of this report, the test data analysis only<br />
considers this model as a long-cash model. It is important to<br />
note that the model can also support a long-short strategy. <br />
• The data analysis is based on a weekly period; this is targeted<br />
for intermediate-term (9–12 month) time horizon investors.<br />
Some mechanics of the model are as follows: If the RSI (14)<br />
closed above both 9- and 45-period moving averages on<br />
a Friday, then due to the weekly frequency, the following<br />
Friday’s close is when the trade would be entered/exited,<br />
thereby creating a time lag in processing in order to simulate<br />
real-time trade processing requirements. <br />
• For the secular bear market 2000–2009, the data output are<br />
total return series that include dividends. <br />
• For the secular bear markets 1929–1942 and 1966–1978, the<br />
data output are price return series. <br />
• For the secular bull markets 1942–1966 and 1978–2000, the<br />
data output are price return series. <br />
• Cash returns were not calculated; the assumption was that<br />
the investor was out of the market. <br />
• Taxes are excluded. <br />
• Transaction costs are included. <br />
• RSI (14) weekly closing data are obtained through FactSet<br />
Research Systems and Bloomberg, L.P. Data are analyzed<br />
using Microsoft Excel 2007. <br />
The backtest for each secular trend scenario was made with<br />
a theoretical starting balance of US $1 million. This would be a<br />
reasonable amount for a registered investment advisor to invest<br />
in as a large cap asset allocation to a portfolio.<br />
The overall time period for backtests include three secular<br />
bear and two secular bull markets applied to the S&P 500 Index<br />
from 1929–2009. The specific dates for each backtest scenario<br />
are as follows:<br />
Secular bear trend scenarios:<br />
9/6/1929–4/28/1942 <br />
1/14/1966–11/17/1978 <br />
1/14/2000–3/6/2009 <br />
Secular bull trend scenarios:<br />
4/28/1942–1/14/1966 <br />
11/17/1978–1/14/2000 <br />
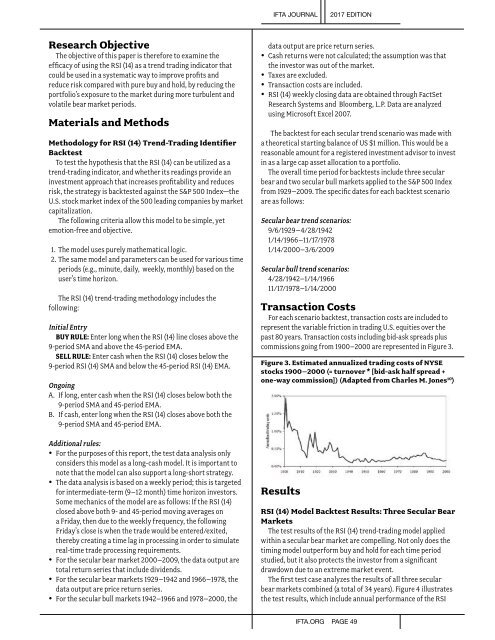
Transaction Costs <br />
For each scenario backtest, transaction costs are included to<br />
represent the variable friction in trading U.S. equities over the<br />
past 80 years. Transaction costs including bid-ask spreads plus<br />
commissions going from 1900–2000 are represented in Figure 3. <br />
Figure 3. Estimated annualized trading costs of NYSE<br />
stocks 1900–2000 (= turnover * [bid-ask half spread +<br />
one-way commission]) (Adapted from Charles M. Jones 10 )<br />
Results<br />
RSI (14) Model Backtest Results: Three Secular Bear<br />
Markets<br />
The test results of the RSI (14) trend-trading model applied<br />
within a secular bear market are compelling. Not only does the<br />
timing model outperform buy and hold for each time period<br />
studied, but it also protects the investor from a significant<br />
drawdown due to an extreme market event.<br />
The first test case analyzes the results of all three secular<br />
bear markets combined (a total of 34 years). Figure 4 illustrates<br />
the test results, which include annual performance of the RSI<br />
IFTA.ORG PAGE 49