


Create successful ePaper yourself
Turn your PDF publications into a flip-book with our unique Google optimized e-Paper software.
IFTA JOURNAL<br />
2017 EDITION<br />
was corrected for 5-day moving average. Based on the following<br />
definitions, trend was verified seeing price transition.<br />
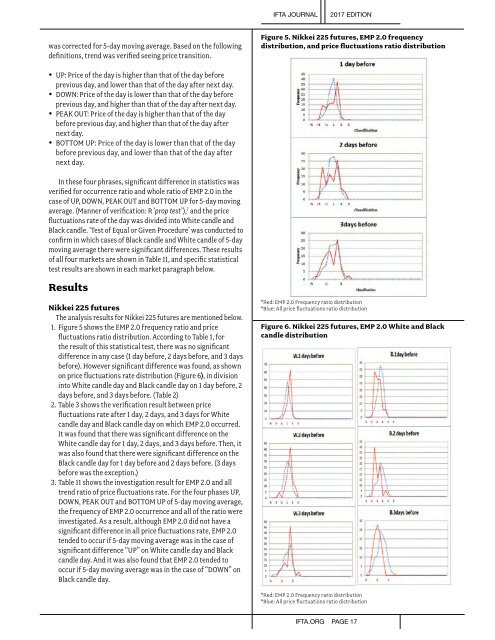
Figure 5. Nikkei 225 futures, EMP 2.0 frequency<br />
distribution, and price fluctuations ratio distribution<br />
• UP: Price of the day is higher than that of the day before<br />
previous day, and lower than that of the day after next day.<br />
• DOWN: Price of the day is lower than that of the day before<br />
previous day, and higher than that of the day after next day.<br />
• PEAK OUT: Price of the day is higher than that of the day<br />
before previous day, and higher than that of the day after<br />
next day.<br />
• BOTTOM UP: Price of the day is lower than that of the day<br />
before previous day, and lower than that of the day after<br />
next day.<br />
In these four phrases, significant difference in statistics was<br />
verified for occurrence ratio and whole ratio of EMP 2.0 in the<br />
case of UP, DOWN, PEAK OUT and BOTTOM UP for 5-day moving<br />
average. (Manner of verification: R ‘prop test’), 7 and the price<br />
fluctuations rate of the day was divided into White candle and<br />
Black candle. ‘Test of Equal or Given Procedure’ was conducted to<br />
confirm in which cases of Black candle and White candle of 5-day<br />
moving average there were significant differences. These results<br />
of all four markets are shown in Table 11, and specific statistical<br />
test results are shown in each market paragraph below.<br />
Results<br />
Nikkei 225 futures<br />
The analysis results for Nikkei 225 futures are mentioned below.<br />
1. Figure 5 shows the EMP 2.0 frequency ratio and price<br />
fluctuations ratio distribution. According to Table 1, for<br />
the result of this statistical test, there was no significant<br />
difference in any case (1 day before, 2 days before, and 3 days<br />
before). However significant difference was found, as shown<br />
on price fluctuations rate distribution (Figure 6), in division<br />
into White candle day and Black candle day on 1 day before, 2<br />
days before, and 3 days before. (Table 2)<br />
2. Table 3 shows the verification result between price<br />
fluctuations rate after 1 day, 2 days, and 3 days for White<br />
candle day and Black candle day on which EMP 2.0 occurred.<br />
It was found that there was significant difference on the<br />
White candle day for 1 day, 2 days, and 3 days before. Then, it<br />
was also found that there were significant difference on the<br />
Black candle day for 1 day before and 2 days before. (3 days<br />
before was the exception.)<br />
3. Table 11 shows the investigation result for EMP 2.0 and all<br />
trend ratio of price fluctuations rate. For the four phases UP,<br />
DOWN, PEAK OUT and BOTTOM UP of 5-day moving average,<br />
the frequency of EMP 2.0 occurrence and all of the ratio were<br />
investigated. As a result, although EMP 2.0 did not have a<br />
significant difference in all price fluctuations rate, EMP 2.0<br />
tended to occur if 5-day moving average was in the case of<br />
significant difference “UP” on White candle day and Black<br />
candle day. And it was also found that EMP 2.0 tended to<br />
occur if 5-day moving average was in the case of “DOWN” on<br />
Black candle day.<br />
*Red: EMP 2.0 Frequency ratio distribution<br />
*Blue: All price fluctuations ratio distribution<br />
Figure 6. Nikkei 225 futures, EMP 2.0 White and Black<br />
candle distribution<br />
*Red: EMP 2.0 Frequency ratio distribution<br />
*Blue: All price fluctuations ratio distribution<br />
IFTA.ORG PAGE 17