


You also want an ePaper? Increase the reach of your titles
YUMPU automatically turns print PDFs into web optimized ePapers that Google loves.
IFTA JOURNAL<br />
2017 EDITION<br />
(14) trend model compared with buy-and-hold for the S&P 500<br />
Index. The model generated fewer large percent losses and<br />
fewer large percent gains compared with buy and hold, which<br />
is supportive of reducing fat-tail or higher-risk events. The<br />
test results summary statistics in Table 1 reveal the following<br />
benefits of using the model compared with buy and hold: 1) a<br />
higher average or mean return; 2) a lower standard deviation or<br />
overall less risk; 3) a more positive skewness than buy-and-hold<br />
(meaning the asymmetric tail extends toward more positive<br />
annual returns); 4) a higher kurtosis value, suggesting that<br />
there was a peak of distribution in the return stream, which in<br />
this case is supportive of more stable returns with less tail risk;<br />
and 5) lower minimum annual return values than buy-and-hold,<br />
and added downside risk protection.<br />
The test results suggest that the RSI (14) model protects the<br />
investor by avoiding extreme unexpected bear market losses.<br />
The mechanics of the model will execute a move to cash when<br />
the RSI (14) indicator triggers a sell signal, thus eliminating any<br />
extreme fat tail losses associated with the buy and hold strategy.<br />
Figure 4. Yearly percent returns in three secular bear<br />
markets<br />
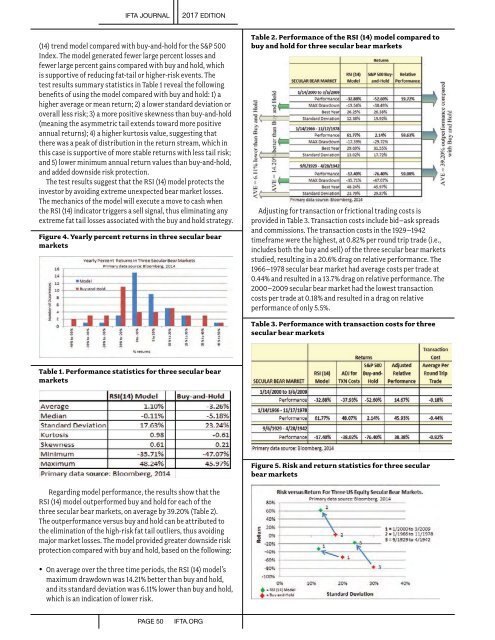
Table 2. Performance of the RSI (14) model compared to<br />
buy and hold for three secular bear markets<br />
Adjusting for transaction or frictional trading costs is<br />
provided in Table 3. Transaction costs include bid–ask spreads<br />
and commissions. The transaction costs in the 1929–1942<br />
timeframe were the highest, at 0.82% per round trip trade (i.e.,<br />
includes both the buy and sell) of the three secular bear markets<br />
studied, resulting in a 20.6% drag on relative performance. The<br />
1966–1978 secular bear market had average costs per trade at<br />
0.44% and resulted in a 13.7% drag on relative performance. The<br />
2000–2009 secular bear market had the lowest transaction<br />
costs per trade at 0.18% and resulted in a drag on relative<br />
performance of only 5.5%.<br />
Table 3. Performance with transaction costs for three<br />
secular bear markets<br />
Table 1. Performance statistics for three secular bear<br />
markets<br />
Figure 5. Risk and return statistics for three secular<br />
bear markets<br />
Regarding model performance, the results show that the<br />
RSI (14) model outperformed buy and hold for each of the<br />
three secular bear markets, on average by 39.20% (Table 2).<br />
The outperformance versus buy and hold can be attributed to<br />
the elimination of the high-risk fat tail outliers, thus avoiding<br />
major market losses. The model provided greater downside risk<br />
protection compared with buy and hold, based on the following:<br />
• On average over the three time periods, the RSI (14) model’s<br />
maximum drawdown was 14.21% better than buy and hold,<br />
and its standard deviation was 6.11% lower than buy and hold,<br />
which is an indication of lower risk.<br />
PAGE 50<br />
IFTA.ORG