


You also want an ePaper? Increase the reach of your titles
YUMPU automatically turns print PDFs into web optimized ePapers that Google loves.
IFTA JOURNAL<br />
2017 EDITION<br />
Forecasting Prices Via Overlays 18 <br />
Figures 23 and 24 are of the Dow Jones Index, and Square of<br />
Nine of increment equal 100 is going to be used.<br />
The bottom of 2002 (7181) is plotted in the Square of Nine.<br />
Cells that are located at 240 degrees from the plotted point are<br />
forming a clear resistance area; thus, the Triangle overlay can be<br />
used in the future forecasting.<br />
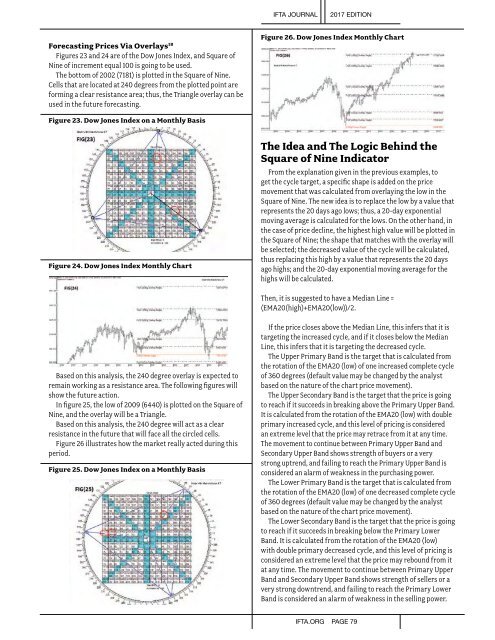
Figure 26. Dow Jones Index Monthly Chart<br />
Figure 23. Dow Jones Index on a Monthly Basis<br />
Figure 24. Dow Jones Index Monthly Chart<br />
The Idea and The Logic Behind the<br />
Square of Nine Indicator<br />
From the explanation given in the previous examples, to<br />
get the cycle target, a specific shape is added on the price<br />
movement that was calculated from overlaying the low in the<br />
Square of Nine. The new idea is to replace the low by a value that<br />
represents the 20 days ago lows; thus, a 20-day exponential<br />
moving average is calculated for the lows. On the other hand, in<br />
the case of price decline, the highest high value will be plotted in<br />
the Square of Nine; the shape that matches with the overlay will<br />
be selected; the decreased value of the cycle will be calculated,<br />
thus replacing this high by a value that represents the 20 days<br />
ago highs; and the 20-day exponential moving average for the<br />
highs will be calculated. <br />
Then, it is suggested to have a Median Line =<br />
(EMA20(high)+EMA20(low))/2.<br />
Based on this analysis, the 240 degree overlay is expected to<br />
remain working as a resistance area. The following figures will<br />
show the future action.<br />
In figure 25, the low of 2009 (6440) is plotted on the Square of<br />
Nine, and the overlay will be a Triangle.<br />
Based on this analysis, the 240 degree will act as a clear<br />
resistance in the future that will face all the circled cells.<br />
Figure 26 illustrates how the market really acted during this<br />
period.<br />
Figure 25. Dow Jones Index on a Monthly Basis<br />
If the price closes above the Median Line, this infers that it is<br />
targeting the increased cycle, and if it closes below the Median<br />
Line, this infers that it is targeting the decreased cycle. <br />
The Upper Primary Band is the target that is calculated from<br />
the rotation of the EMA20 (low) of one increased complete cycle<br />
of 360 degrees (default value may be changed by the analyst<br />
based on the nature of the chart price movement). <br />
The Upper Secondary Band is the target that the price is going<br />
to reach if it succeeds in breaking above the Primary Upper Band.<br />
It is calculated from the rotation of the EMA20 (low) with double<br />
primary increased cycle, and this level of pricing is considered<br />
an extreme level that the price may retrace from it at any time.<br />
The movement to continue between Primary Upper Band and<br />
Secondary Upper Band shows strength of buyers or a very<br />
strong uptrend, and failing to reach the Primary Upper Band is<br />
considered an alarm of weakness in the purchasing power. <br />
The Lower Primary Band is the target that is calculated from<br />
the rotation of the EMA20 (low) of one decreased complete cycle<br />
of 360 degrees (default value may be changed by the analyst<br />
based on the nature of the chart price movement). <br />
The Lower Secondary Band is the target that the price is going<br />
to reach if it succeeds in breaking below the Primary Lower<br />
Band. It is calculated from the rotation of the EMA20 (low)<br />
with double primary decreased cycle, and this level of pricing is<br />
considered an extreme level that the price may rebound from it<br />
at any time. The movement to continue between Primary Upper<br />
Band and Secondary Upper Band shows strength of sellers or a<br />
very strong downtrend, and failing to reach the Primary Lower<br />
Band is considered an alarm of weakness in the selling power. <br />
IFTA.ORG PAGE 79