


You also want an ePaper? Increase the reach of your titles
YUMPU automatically turns print PDFs into web optimized ePapers that Google loves.
IFTA JOURNAL<br />
2017 EDITION<br />
Discussion<br />
While the results are very favorable for the Composite Index<br />
compared to the RSI, this study is going to immediately raise<br />
a question for the reader who is in a trading environment.<br />
‘Does the Composite Index provide divergence signals when<br />
the RSI does not in other markets and in other timeframes?<br />
The author is a global equity index specialist. It has only<br />
been used in financial markets and specifically with financial<br />
futures contracts for trading. Experience has shown that the<br />
Composite Index can be used within long horizon and short<br />
horizon timeframes. However, charts displaying long horizon<br />
Government Treasury market data will find that the Composite<br />
Index will have more frequent and timely divergences if the<br />
oscillator is applied to yields. However, traders will find it of<br />
value in treasury futures markets in shorter horizon charts<br />
of weekly and shorter intervals because the trends are more<br />
distinctive in these shorter time periods.<br />
Intraday signals of divergence have been observed for nearly<br />
30 years on S&P500 futures. In this market, the Composite<br />
Index has had extensive real-time use.<br />
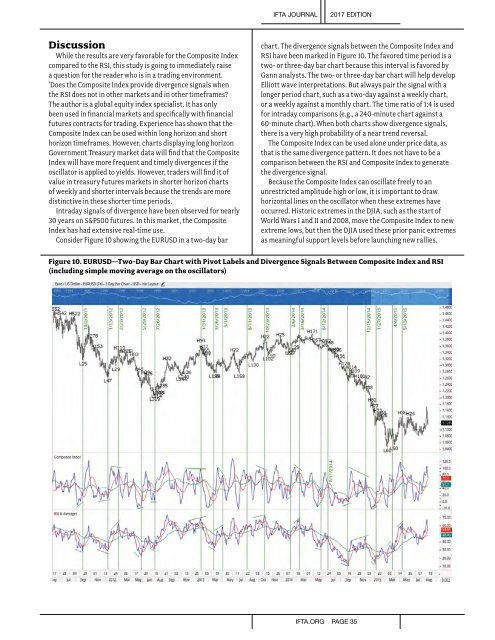
Consider Figure 10 showing the EURUSD in a two-day bar<br />
chart. The divergence signals between the Composite Index and<br />
RSI have been marked in Figure 10. The favored time period is a<br />
two- or three-day bar chart because this interval is favored by<br />
Gann analysts. The two- or three-day bar chart will help develop<br />
Elliott wave interpretations. But always pair the signal with a<br />
longer period chart, such as a two-day against a weekly chart,<br />
or a weekly against a monthly chart. The time ratio of 1:4 is used<br />
for intraday comparisons (e.g., a 240-minute chart against a<br />
60-minute chart). When both charts show divergence signals,<br />
there is a very high probability of a near trend reversal.<br />
The Composite Index can be used alone under price data, as<br />
that is the same divergence pattern. It does not have to be a<br />
comparison between the RSI and Composite Index to generate<br />
the divergence signal.<br />
Because the Composite Index can oscillate freely to an<br />
unrestricted amplitude high or low, it is important to draw<br />
horizontal lines on the oscillator when these extremes have<br />
occurred. Historic extremes in the DJIA, such as the start of<br />
World Wars I and II and 2008, move the Composite Index to new<br />
extreme lows, but then the DJIA used these prior panic extremes<br />
as meaningful support levels before launching new rallies.<br />
Figure 10. EURUSD—Two-Day Bar Chart with Pivot Labels and Divergence Signals Between Composite Index and RSI<br />
(including simple moving average on the oscillators)<br />
IFTA.ORG PAGE 35