


You also want an ePaper? Increase the reach of your titles
YUMPU automatically turns print PDFs into web optimized ePapers that Google loves.
IFTA JOURNAL<br />
2017 EDITION<br />
Table 9. Results of Skyworks Average Gain/Trade<br />
Skyworks Bear Market Bull Market<br />
Average Loss $(0.23) $(0.68)<br />
Average Gain $0.66 $6.64<br />
The SCTR for the S&P 500 ETF (SPY)<br />
For reference, as part of the results section, I have shown the<br />
SPY ETF with an SCTR ranking against other ETFs. While the<br />
$SPX has enjoyed a tremendous move down and up over the<br />
past eight years, the SCTR shows that it performs adequately<br />
but subpar to the moves investors could have achieved using the<br />
SCTR to point them to the most strength. (Figure 7)<br />
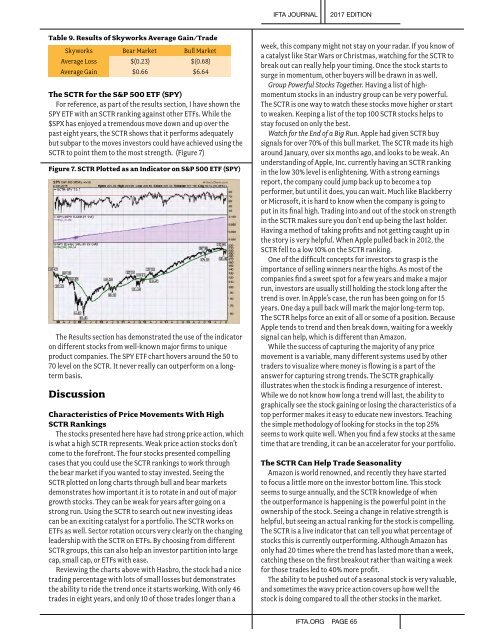
Figure 7. SCTR Plotted as an Indicator on S&P 500 ETF (SPY)<br />
The Results section has demonstrated the use of the indicator<br />
on different stocks from well-known major firms to unique<br />
product companies. The SPY ETF chart hovers around the 50 to<br />
70 level on the SCTR. It never really can outperform on a longterm<br />
basis.<br />
Discussion<br />
Characteristics of Price Movements With High<br />
SCTR Rankings<br />
The stocks presented here have had strong price action, which<br />
is what a high SCTR represents. Weak price action stocks don’t<br />
come to the forefront. The four stocks presented compelling<br />
cases that you could use the SCTR rankings to work through<br />
the bear market if you wanted to stay invested. Seeing the<br />
SCTR plotted on long charts through bull and bear markets<br />
demonstrates how important it is to rotate in and out of major<br />
growth stocks. They can be weak for years after going on a<br />
strong run. Using the SCTR to search out new investing ideas<br />
can be an exciting catalyst for a portfolio. The SCTR works on<br />
ETFs as well. Sector rotation occurs very clearly on the changing<br />
leadership with the SCTR on ETFs. By choosing from different<br />
SCTR groups, this can also help an investor partition into large<br />
cap, small cap, or ETFs with ease.<br />
Reviewing the charts above with Hasbro, the stock had a nice<br />
trading percentage with lots of small losses but demonstrates<br />
the ability to ride the trend once it starts working. With only 46<br />
trades in eight years, and only 10 of those trades longer than a<br />
week, this company might not stay on your radar. If you know of<br />
a catalyst like Star Wars or Christmas, watching for the SCTR to<br />
break out can really help your timing. Once the stock starts to<br />
surge in momentum, other buyers will be drawn in as well.<br />
Group Powerful Stocks Together. Having a list of highmomentum<br />
stocks in an industry group can be very powerful.<br />
The SCTR is one way to watch these stocks move higher or start<br />
to weaken. Keeping a list of the top 100 SCTR stocks helps to<br />
stay focused on only the best.<br />
Watch for the End of a Big Run. Apple had given SCTR buy<br />
signals for over 70% of this bull market. The SCTR made its high<br />
around January, over six months ago, and looks to be weak. An<br />
understanding of Apple, Inc. currently having an SCTR ranking<br />
in the low 30% level is enlightening. With a strong earnings<br />
report, the company could jump back up to become a top<br />
performer, but until it does, you can wait. Much like Blackberry<br />
or Microsoft, it is hard to know when the company is going to<br />
put in its final high. Trading into and out of the stock on strength<br />
in the SCTR makes sure you don’t end up being the last holder.<br />
Having a method of taking profits and not getting caught up in<br />
the story is very helpful. When Apple pulled back in 2012, the<br />
SCTR fell to a low 10% on the SCTR ranking.<br />
One of the difficult concepts for investors to grasp is the<br />
importance of selling winners near the highs. As most of the<br />
companies find a sweet spot for a few years and make a major<br />
run, investors are usually still holding the stock long after the<br />
trend is over. In Apple’s case, the run has been going on for 15<br />
years. One day a pull back will mark the major long-term top.<br />
The SCTR helps force an exit of all or some of a position. Because<br />
Apple tends to trend and then break down, waiting for a weekly<br />
signal can help, which is different than Amazon.<br />
While the success of capturing the majority of any price<br />
movement is a variable, many different systems used by other<br />
traders to visualize where money is flowing is a part of the<br />
answer for capturing strong trends. The SCTR graphically<br />
illustrates when the stock is finding a resurgence of interest.<br />
While we do not know how long a trend will last, the ability to<br />
graphically see the stock gaining or losing the characteristics of a<br />
top performer makes it easy to educate new investors. Teaching<br />
the simple methodology of looking for stocks in the top 25%<br />
seems to work quite well. When you find a few stocks at the same<br />
time that are trending, it can be an accelerator for your portfolio.<br />
The SCTR Can Help Trade Seasonality<br />
Amazon is world renowned, and recently they have started<br />
to focus a little more on the investor bottom line. This stock<br />
seems to surge annually, and the SCTR knowledge of when<br />
the outperformance is happening is the powerful point in the<br />
ownership of the stock. Seeing a change in relative strength is<br />
helpful, but seeing an actual ranking for the stock is compelling.<br />
The SCTR is a live indicator that can tell you what percentage of<br />
stocks this is currently outperforming. Although Amazon has<br />
only had 20 times where the trend has lasted more than a week,<br />
catching these on the first breakout rather than waiting a week<br />
for those trades led to 40% more profit.<br />
The ability to be pushed out of a seasonal stock is very valuable,<br />
and sometimes the wavy price action covers up how well the<br />
stock is doing compared to all the other stocks in the market.<br />
IFTA.ORG PAGE 65