


Create successful ePaper yourself
Turn your PDF publications into a flip-book with our unique Google optimized e-Paper software.
IFTA JOURNAL<br />
2017 EDITION<br />
Sell on the open the day after a sell signal is generated moving<br />
below 75%. (Figure 2)<br />
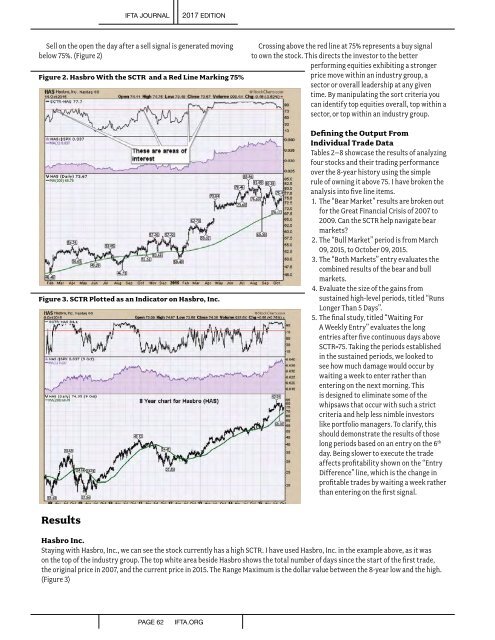
Figure 2. Hasbro With the SCTR and a Red Line Marking 75%<br />
Figure 3. SCTR Plotted as an Indicator on Hasbro, Inc.<br />
Crossing above the red line at 75% represents a buy signal<br />
to own the stock. This directs the investor to the better<br />
performing equities exhibiting a stronger<br />
price move within an industry group, a<br />
sector or overall leadership at any given<br />
time. By manipulating the sort criteria you<br />
can identify top equities overall, top within a<br />
sector, or top within an industry group.<br />
Defining the Output From<br />
Individual Trade Data<br />
Tables 2–8 showcase the results of analyzing<br />
four stocks and their trading performance<br />
over the 8-year history using the simple<br />
rule of owning it above 75. I have broken the<br />
analysis into five line items.<br />
1. The “Bear Market” results are broken out<br />
for the Great Financial Crisis of 2007 to<br />
2009. Can the SCTR help navigate bear<br />
markets?<br />
2. The “Bull Market” period is from March<br />
09, 2015, to October 09, 2015.<br />
3. The “Both Markets” entry evaluates the<br />
combined results of the bear and bull<br />
markets.<br />
4. Evaluate the size of the gains from<br />
sustained high-level periods, titled “Runs<br />
Longer Than 5 Days”.<br />
5. The final study, titled “Waiting For<br />
A Weekly Entry” evaluates the long<br />
entries after five continuous days above<br />
SCTR=75. Taking the periods established<br />
in the sustained periods, we looked to<br />
see how much damage would occur by<br />
waiting a week to enter rather than<br />
entering on the next morning. This<br />
is designed to eliminate some of the<br />
whipsaws that occur with such a strict<br />
criteria and help less nimble investors<br />
like portfolio managers. To clarify, this<br />
should demonstrate the results of those<br />
long periods based on an entry on the 6 th<br />
day. Being slower to execute the trade<br />
affects profitability shown on the “Entry<br />
Difference” line, which is the change in<br />
profitable trades by waiting a week rather<br />
than entering on the first signal.<br />
Results<br />
Hasbro Inc.<br />
Staying with Hasbro, Inc., we can see the stock currently has a high SCTR. I have used Hasbro, Inc. in the example above, as it was<br />
on the top of the industry group. The top white area beside Hasbro shows the total number of days since the start of the first trade,<br />
the original price in 2007, and the current price in 2015. The Range Maximum is the dollar value between the 8-year low and the high.<br />
(Figure 3)<br />
PAGE 62<br />
IFTA.ORG