


You also want an ePaper? Increase the reach of your titles
YUMPU automatically turns print PDFs into web optimized ePapers that Google loves.
IFTA JOURNAL<br />
2017 EDITION<br />
years that includes the 20-month moving average. The moving<br />
average has been a near perfect trend indicator over the past<br />
20 years. The red arrows show the MA’s clean signals, while the<br />
blue arrows show the failed signals. We did not include the two<br />
recent failed signals. Those notwithstanding, the 20-month<br />
moving average has been an excellent indicator and certainly<br />
superior to the 10-month moving average (the equivalent of the<br />
200-day moving average).<br />
Figure 2: MSCI Emerging Markets Free Index with 20-Month Moving Average<br />
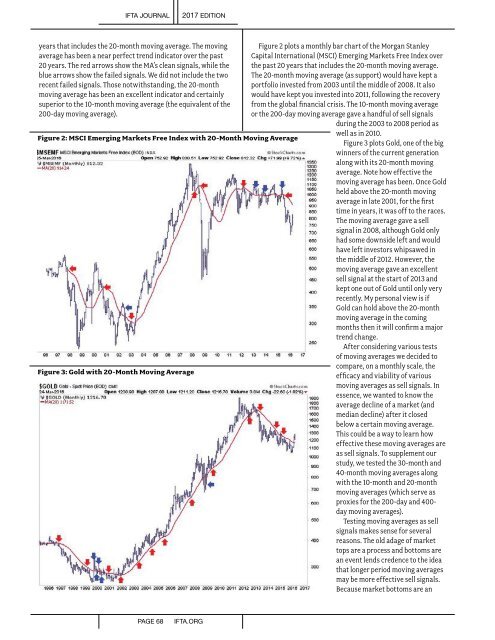
Figure 3: Gold with 20-Month Moving Average<br />
Figure 2 plots a monthly bar chart of the Morgan Stanley<br />
Capital International (MSCI) Emerging Markets Free Index over<br />
the past 20 years that includes the 20-month moving average.<br />
The 20-month moving average (as support) would have kept a<br />
portfolio invested from 2003 until the middle of 2008. It also<br />
would have kept you invested into 2011, following the recovery<br />
from the global financial crisis. The 10-month moving average<br />
or the 200-day moving average gave a handful of sell signals<br />
during the 2003 to 2008 period as<br />
well as in 2010.<br />
Figure 3 plots Gold, one of the big<br />
winners of the current generation<br />
along with its 20-month moving<br />
average. Note how effective the<br />
moving average has been. Once Gold<br />
held above the 20-month moving<br />
average in late 2001, for the first<br />
time in years, it was off to the races.<br />
The moving average gave a sell<br />
signal in 2008, although Gold only<br />
had some downside left and would<br />
have left investors whipsawed in<br />
the middle of 2012. However, the<br />
moving average gave an excellent<br />
sell signal at the start of 2013 and<br />
kept one out of Gold until only very<br />
recently. My personal view is if<br />
Gold can hold above the 20-month<br />
moving average in the coming<br />
months then it will confirm a major<br />
trend change.<br />
After considering various tests<br />
of moving averages we decided to<br />
compare, on a monthly scale, the<br />
efficacy and viability of various<br />
moving averages as sell signals. In<br />
essence, we wanted to know the<br />
average decline of a market (and<br />
median decline) after it closed<br />
below a certain moving average.<br />
This could be a way to learn how<br />
effective these moving averages are<br />
as sell signals. To supplement our<br />
study, we tested the 30-month and<br />
40-month moving averages along<br />
with the 10-month and 20-month<br />
moving averages (which serve as<br />
proxies for the 200-day and 400-<br />
day moving averages).<br />
Testing moving averages as sell<br />
signals makes sense for several<br />
reasons. The old adage of market<br />
tops are a process and bottoms are<br />
an event lends credence to the idea<br />
that longer period moving averages<br />
may be more effective sell signals.<br />
Because market bottoms are an<br />
PAGE 68<br />
IFTA.ORG