


Create successful ePaper yourself
Turn your PDF publications into a flip-book with our unique Google optimized e-Paper software.
IFTA JOURNAL<br />
2017 EDITION<br />
StockCharts Technical Ranking (SCTR) System: How<br />
the SCTR Indicator Can Help Novice and Advanced<br />
Investors Rapidly Evaluate a Stock in Real Time<br />
By Gregory Allen Schnell, CMT, MFTA<br />
Gregory Allen Schnell, CMT, MFTA<br />
StockCharts.com<br />
gregs@stockcharts.com<br />
144 Lake Mead Crescent SE<br />
Calgary, AB, T2J 4A1<br />
+1 (403) 999 - 7647<br />
Abstract<br />
This paper defines the StockCharts Technical Ranking<br />
(SCTR)© indicator. The indicator has four main features. It<br />
ranks how a stock price action is performing to a large peer<br />
group in real time, assigning a value between 0–100. SCTR<br />
plots the history of the stock’s relative performance, including<br />
current value. The value does not change across different<br />
plotted time frames of hourly, daily or monthly. The SCTR<br />
provides a single value for a stock performance compared to its<br />
peers for use by technical or fundamental investing styles.<br />
Introduction<br />
This paper defines how I use the StockCharts.com Technical<br />
Ranking (SCTR)© indicator. This paper is also the first<br />
introduction of the SCTR to the global professional community<br />
of technical analysis. The indicator has been presented in<br />
workshops designed to help users of the StockCharts.com<br />
website over the years. It was recently refined in 2014. This<br />
documents one of the many interpretations and uses for the<br />
data of the plotted indicator to demonstrate the relative value.<br />
The four features of the SCTR<br />
The indicator has four main features. The SCTR ranks how a<br />
stock price action is performing relative to a defined peer group<br />
in real time. This is a larger group than just an industry group.<br />
StockCharts.com has created three groups based on Market Cap<br />
in large markets like the U.S. market. The SCTR gives a value<br />
between 0–100. A ranking of 94 would suggest the stock is<br />
behaving better than 94% of the stocks in the peer group.<br />
Secondly, when plotted as an indicator, it also shows the<br />
history of the stock’s relative performance to its group. The<br />
value of the SCTR indicator at a point in time is the same across<br />
all timeframes of minute, 10-minute, hourly, daily or monthly.<br />
The SCTR indicator has the ability to quickly outline a stock’s<br />
performance compared to its peers in one number for use by<br />
technical or fundamental investing styles. It can educate new<br />
or experienced investors by calculating a value for the relative<br />
quality of price movement even though they all have a different<br />
price. The SCTR quickly disseminates which stocks have better<br />
price action than others. Once the indicator is explained,<br />
investors can quickly evaluate a stock’s relative price action<br />
compared to other stocks in the group in a tabular or chart<br />
format. Apple currently has an SCTR of 31.5, and this paper will<br />
supply information on understanding that value.<br />
The last benefit of the SCTR is that it helps investors<br />
eventually get a portfolio of very fast-moving stocks and<br />
provides a simple exit plan to retain the gains. When you are in<br />
very strong SCTR stocks and each one is trending very quickly,<br />
your portfolio can capture dynamic, outsized gains, and the<br />
indicator leads you to these stocks every day.<br />
Materials and Methods<br />
Calculating an SCTR<br />
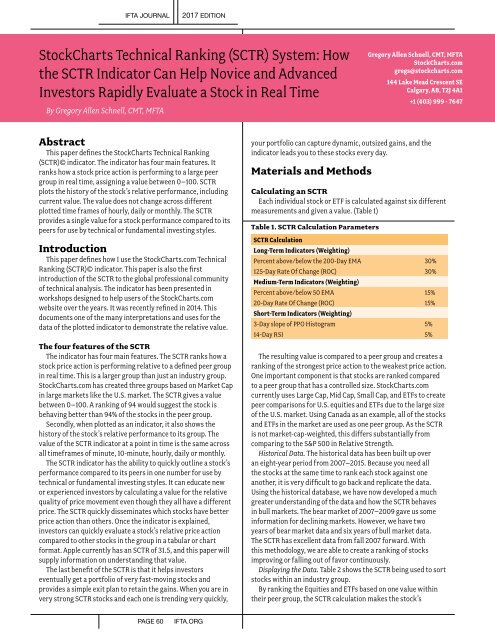
Each individual stock or ETF is calculated against six different<br />
measurements and given a value. (Table 1)<br />
Table 1. SCTR Calculation Parameters<br />
SCTR Calculation<br />
Long-Term Indicators (Weighting)<br />
Percent above/below the 200-Day EMA 30%<br />
125-Day Rate Of Change (ROC) 30%<br />
Medium-Term Indicators (Weighting)<br />
Percent above/below 50 EMA 15%<br />
20-Day Rate Of Change (ROC) 15%<br />
Short-Term Indicators (Weighting)<br />
3-Day slope of PPO Histogram 5%<br />
14-Day RSI 5%<br />
The resulting value is compared to a peer group and creates a<br />
ranking of the strongest price action to the weakest price action.<br />
One important component is that stocks are ranked compared<br />
to a peer group that has a controlled size. StockCharts.com<br />
currently uses Large Cap, Mid Cap, Small Cap, and ETFs to create<br />
peer comparisons for U.S. equities and ETFs due to the large size<br />
of the U.S. market. Using Canada as an example, all of the stocks<br />
and ETFs in the market are used as one peer group. As the SCTR<br />
is not market-cap-weighted, this differs substantially from<br />
comparing to the S&P 500 in Relative Strength.<br />
Historical Data. The historical data has been built up over<br />
an eight-year period from 2007–2015. Because you need all<br />
the stocks at the same time to rank each stock against one<br />
another, it is very difficult to go back and replicate the data.<br />
Using the historical database, we have now developed a much<br />
greater understanding of the data and how the SCTR behaves<br />
in bull markets. The bear market of 2007–2009 gave us some<br />
information for declining markets. However, we have two<br />
years of bear market data and six years of bull market data.<br />
The SCTR has excellent data from fall 2007 forward. With<br />
this methodology, we are able to create a ranking of stocks<br />
improving or falling out of favor continuously.<br />
Displaying the Data. Table 2 shows the SCTR being used to sort<br />
stocks within an industry group.<br />
By ranking the Equities and ETFs based on one value within<br />
their peer group, the SCTR calculation makes the stock’s<br />
PAGE 60<br />
IFTA.ORG