


You also want an ePaper? Increase the reach of your titles
YUMPU automatically turns print PDFs into web optimized ePapers that Google loves.
IFTA JOURNAL<br />
2017 EDITION<br />
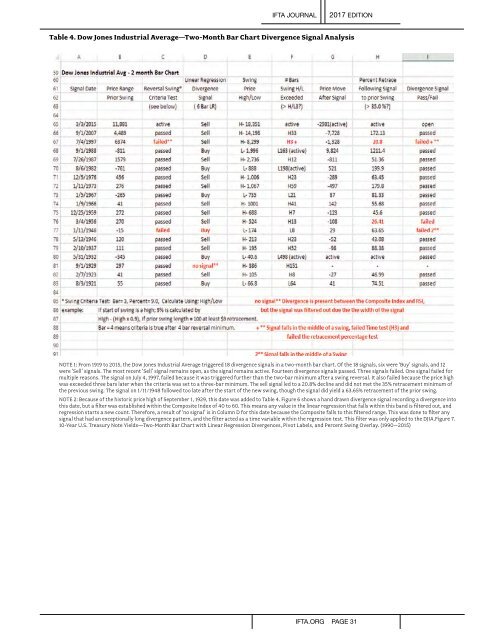
Table 4. Dow Jones Industrial Average—Two-Month Bar Chart Divergence Signal Analysis<br />
NOTE 1: From 1919 to 2015, the Dow Jones Industrial Average triggered 18 divergence signals in a two-month bar chart. Of the 18 signals, six were ‘Buy’ signals, and 12<br />
were ‘Sell’ signals. The most recent ‘Sell’ signal remains open, as the signal remains active. Fourteen divergence signals passed. Three signals failed. One signal failed for<br />
multiple reasons. The signal on July 4, 1997, failed because it was triggered further than the two-bar minimum after a swing reversal. It also failed because the price high<br />
was exceeded three bars later when the criteria was set to a three-bar minimum. The sell signal led to a 20.8% decline and did not met the 35% retracement minimum of<br />
the previous swing. The signal on 1/11/1948 followed too late after the start of the new swing, though the signal did yield a 63.65% retracement of the prior swing.<br />
NOTE 2: Because of the historic price high of September 1, 1929, this date was added to Table 4. Figure 6 shows a hand drawn divergence signal recording a divergence into<br />
this date, but a filter was established within the Composite Index of 40 to 60. This means any value in the linear regression that falls within this band is filtered out, and<br />
regression starts a new count. Therefore, a result of ‘no signal’ is in Column D for this date because the Composite falls to this filtered range. This was done to filter any<br />
signal that had an exceptionally long divergence pattern, and the filter acted as a time variable within the regression test. This filter was only applied to the DJIA.Figure 7.<br />
10-Year U.S. Treasury Note Yields—Two-Month Bar Chart with Linear Regression Divergences, Pivot Labels, and Percent Swing Overlay. (1990–2015)<br />
IFTA.ORG PAGE 31