


You also want an ePaper? Increase the reach of your titles
YUMPU automatically turns print PDFs into web optimized ePapers that Google loves.
IFTA JOURNAL<br />
2017 EDITION<br />
they are an essential component of almost every volatility or<br />
option pricing formula. The theory holds that stock prices move<br />
over the long and short term in a square root relationship. For<br />
example IBM made a monthly closing low of 4.52 in June, 1962 and<br />
monthly closing high of 125.69 in July, 1999. This is within a few<br />
percentage points of the square of the sum of the square root of<br />
the low price + 9 or (2.12+9)^2. GM made a low of 15 in November,<br />
1974 and a high of 95 in May, 1999. Again, a few percentage points<br />
from the square of the sum of the square root of the low + 6 or<br />
(3.87+6)^2. There are hundreds and hundreds of these examples<br />
across the stock, financial and commodity markets. Even a few<br />
minutes with a pile of stock charts and a calculator will build<br />
confidence that major highs and lows are related to each other by<br />
additions and subtractions to their square roots. The Square of<br />
Nine takes these square root relationships to a different level as<br />
you will learn in the pages ahead.”<br />
“We use the square of odd and even numbers to get not only the<br />
proof of market movements but the cause“ (W. D. Gann, The Basis<br />
of My Forecasting Method (the Geometrical Angles course), p.1. 6<br />
Square of Nine<br />
Before we continue with our illustration, it is important to<br />
know some information about W.D. Gann. He was a financial<br />
advisor and trader in the stock and commodity markets during<br />
the first half of the 20th century. In the 1920s, he developed the<br />
Square of Nine as a financial tool for trading and forecasting.<br />
Methods of using it were taught by W.D. Gann in his private<br />
financial seminars and written trading courses. In his later<br />
books, he started to use Circle of 24 and Hexagon. In the<br />
following paragraphs, the basic concepts that those charts are<br />
drawn upon are going to be explained.<br />
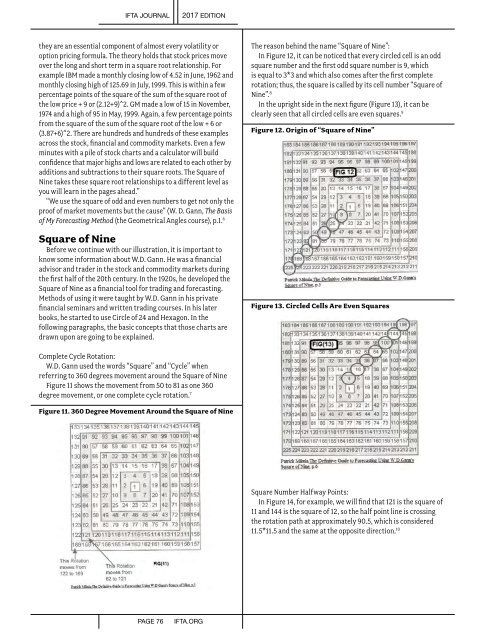
The reason behind the name “Square of Nine”:<br />
In Figure 12, it can be noticed that every circled cell is an odd<br />
square number and the first odd square number is 9, which<br />
is equal to 3*3 and which also comes after the first complete<br />
rotation; thus, the square is called by its cell number “Square of<br />
Nine”. 8<br />
In the upright side in the next figure (Figure 13), it can be<br />
clearly seen that all circled cells are even squares. 9<br />
Figure 12. Origin of “Square of Nine”<br />
Figure 13. Circled Cells Are Even Squares<br />
Complete Cycle Rotation:<br />
W.D. Gann used the words “Square” and “Cycle” when<br />
referring to 360 degrees movement around the Square of Nine<br />
Figure 11 shows the movement from 50 to 81 as one 360<br />
degree movement, or one complete cycle rotation. 7<br />
Figure 11. 360 Degree Movement Around the Square of Nine<br />
Square Number Halfway Points:<br />
In Figure 14, for example, we will find that 121 is the square of<br />
11 and 144 is the square of 12, so the half point line is crossing<br />
the rotation path at approximately 90.5, which is considered<br />
11.5*11.5and the same at the opposite direction. 10<br />
PAGE 76<br />
IFTA.ORG