


You also want an ePaper? Increase the reach of your titles
YUMPU automatically turns print PDFs into web optimized ePapers that Google loves.
IFTA JOURNAL<br />
2017 EDITION<br />
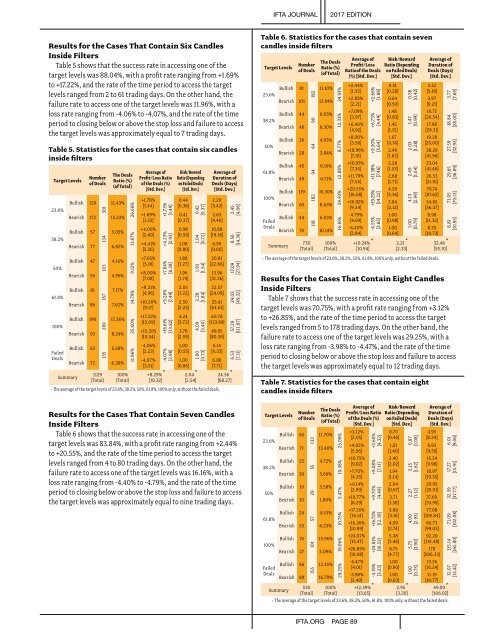
Results for the Cases That Contain Six Candles<br />
Inside Filters<br />
Table 5 shows that the success rate in accessing one of the<br />
target levels was 88.04%, with a profit rate ranging from +1.69%<br />
to +17.22%, and the rate of the time period to access the target<br />
levels ranged from 2 to 61 trading days. On the other hand, the<br />
failure rate to access one of the target levels was 11.96%, with a<br />
loss rate ranging from -4.06% to -4.07%, and the rate of the time<br />
period to closing below or above the stop loss and failure to access<br />
the target levels was approximately equal to 7 trading days.<br />
Table 5. Statistics for the cases that contain six candles<br />
inside filters<br />
Target Levels<br />
23.6%<br />
38.2%<br />
50%<br />
61.8%<br />
100%<br />
Failed<br />
Deals<br />
Summary<br />
Bullish 129<br />
Number<br />
of Deals<br />
301<br />
The Deals<br />
Ratio (%)<br />
(of Total)<br />
11.43%<br />
Bearish 172 15.23%<br />
Bullish 57<br />
134<br />
5.05%<br />
Bearish 77 6.82%<br />
Bullish 47<br />
103<br />
4.16%<br />
Bearish 56 4.96%<br />
Bullish 81<br />
167<br />
7.17%<br />
Bearish 86 7.62%<br />
Bullish 196<br />
289<br />
17.36%<br />
Bearish 93 8.24%<br />
Bullish 63<br />
135<br />
5.58%<br />
Bearish 72 6.38%<br />
1129<br />
(Total)<br />
100%<br />
(Total)<br />
26.66%<br />
11.87%<br />
9.12%<br />
14.79%<br />
25.60%<br />
11.96%<br />
Average of<br />
Profit/Loss Ratio<br />
of the Deals (%)<br />
[Std. Dev.]<br />
+1.78%<br />
[1.44]<br />
+1.69%<br />
[1.53]<br />
+4.00%<br />
[2.40]<br />
+4.41%<br />
[3.26]<br />
+7.65%<br />
[5.16]<br />
+8.00%<br />
[7.08]<br />
+8.31%<br />
[4.96]<br />
+10.20%<br />
[9.17]<br />
+17.22%<br />
[15.09]<br />
+15.31%<br />
[10.54]<br />
-4.06%<br />
[2.23]<br />
-4.07%<br />
[3.51]<br />
+8.29% *<br />
[10.32]<br />
+1.73%<br />
[1.49]<br />
+4.23%<br />
[2.93]<br />
+7.84%<br />
[6.28]<br />
+9.28%<br />
[7.49]<br />
+16.61%<br />
[13.82]<br />
-4.07%<br />
[2.98]<br />
Risk/Reward<br />
Ratio (Depending<br />
on Failed Deals)<br />
[Std. Dev.]<br />
0.44<br />
[0.36]<br />
0.41<br />
[0.37]<br />
0.98<br />
[0.59]<br />
1.08<br />
[0.80]<br />
1.88<br />
[1.27]<br />
1.96<br />
[1.74]<br />
2.05<br />
[1.22]<br />
2.50<br />
[2.25]<br />
4.24<br />
[3.72]<br />
3.76<br />
[2.59]<br />
1.00<br />
[0.55]<br />
1.00<br />
[0.86]<br />
2.04 *<br />
[2.54]<br />
0.42<br />
[0.37]<br />
1.04<br />
[0.72]<br />
1.93<br />
[1.54]<br />
2.28<br />
[1.84]<br />
4.09<br />
[3.40]<br />
1.00<br />
[0.73]<br />
Average of<br />
Duration of<br />
Deals (Days)<br />
[Std. Dev.]<br />
2.20<br />
[3.43]<br />
2.63<br />
[4.46]<br />
10.68<br />
[19.18]<br />
6.99<br />
[9.00]<br />
20.81<br />
[22.66]<br />
13.96<br />
[31.36]<br />
22.57<br />
[24.08]<br />
25.41<br />
[64.61]<br />
60.78<br />
[123.89]<br />
49.95<br />
[80.39]<br />
6.14<br />
[6.33]<br />
6.88<br />
[7.71]<br />
* The average of the target levels of 23.6%, 38.2%, 50%, 61.8%, 100% only, without the failed deals.<br />
24.36 *<br />
[68.27]<br />
2.45<br />
[4.06]<br />
8.56<br />
[14.36]<br />
17.09<br />
[27.94]<br />
24.03<br />
[49.32]<br />
57.29<br />
[111.87]<br />
6.53<br />
[7.11]<br />
Results for the Cases That Contain Seven Candles<br />
Inside Filters<br />
Table 6 shows that the success rate in accessing one of the<br />
target levels was 83.84%, with a profit rate ranging from +2.44%<br />
to +20.55%, and the rate of the time period to access the target<br />
levels ranged from 4 to 80 trading days. On the other hand, the<br />
failure rate to access one of the target levels was 16.16%, with a<br />
loss rate ranging from -4.40% to -4.79%, and the rate of the time<br />
period to closing below or above the stop loss and failure to access<br />
the target levels was approximately equal to nine trading days.<br />
Table 6. Statistics for the cases that contain seven<br />
candles inside filters<br />
Target Levels<br />
23.6%<br />
Bullish 81<br />
Number<br />
of Deals<br />
182<br />
The Deals<br />
Ratio (%)<br />
(of Total)<br />
11.10%<br />
Bearish 101 13.84%<br />
Bullish 44 6.03%<br />
38.2%<br />
Bearish 46 6.30%<br />
50%<br />
61.8%<br />
100%<br />
Failed<br />
Deals<br />
Summary<br />
Bullish 36<br />
90<br />
64<br />
4.93%<br />
Bearish 28 3.84%<br />
Bullish 45<br />
94<br />
6.16%<br />
Bearish 49 6.71%<br />
Bullish 119<br />
182<br />
16.30%<br />
Bearish 63 8.63%<br />
Bullish 44<br />
118<br />
6.03%<br />
Bearish 74 10.14%<br />
730<br />
(Total)<br />
24.93%<br />
12.33%<br />
8.77%<br />
12.88%<br />
24.93%<br />
16.16%<br />
100%<br />
(Total)<br />
Average of<br />
Profit/Loss<br />
Ratioof the Deals<br />
(%) [Std. Dev.]<br />
+2.44%<br />
[1.35]<br />
+2.83%<br />
[2.21]<br />
+7.09%<br />
[3.97]<br />
+6.40%<br />
[4.92]<br />
+8.00%<br />
[3.56]<br />
+10.96%<br />
[7.18]<br />
+10.93%<br />
[7.35]<br />
+11.79%<br />
[7.54]<br />
+20.55%<br />
[16.08]<br />
+16.92%<br />
[9.34]<br />
-4.79%<br />
[4.69]<br />
-4.40%<br />
[2.84]<br />
+10.24% *<br />
[10.94]<br />
+2.66%<br />
[1.88]<br />
+6.73%<br />
[4.49]<br />
+9.30%<br />
[5.64]<br />
+11.38%<br />
[7.46]<br />
+19.29%<br />
[14.22]<br />
-4.55%<br />
[3.65]<br />
Risk/Reward<br />
Ratio (Depending<br />
on Failed Deals)<br />
[Std. Dev.]<br />
0.51<br />
[0.28]<br />
0.64<br />
[0.50]<br />
1.48<br />
[0.83]<br />
1.45<br />
[1.12]<br />
1.67<br />
[0.74]<br />
2.49<br />
[1.63]<br />
2.28<br />
[1.53]<br />
2.68<br />
[1.71]<br />
4.29<br />
[3.36]<br />
3.84<br />
[2.12]<br />
1.00<br />
[0.98]<br />
1.00<br />
[0.64]<br />
2.21 *<br />
[2.33]<br />
0.58<br />
[0.42]<br />
1.47<br />
[0.99]<br />
2.03<br />
[1.28]<br />
2.49<br />
[1.64]<br />
4.13<br />
[2.99]<br />
1.00<br />
[0.79]<br />
Average of<br />
Duration of<br />
Deals (Days)<br />
[Std. Dev.]<br />
3.52<br />
[5.19]<br />
3.97<br />
[9.21]<br />
19.75<br />
[26.54]<br />
17.98<br />
[29.31]<br />
19.28<br />
[20.00]<br />
38.29<br />
[41.96]<br />
33.04<br />
[41.46]<br />
26.53<br />
[31.81]<br />
79.74<br />
[87.62]<br />
54.65<br />
[56.37]<br />
8.98<br />
[11.32]<br />
8.70<br />
[10.73]<br />
* The average of the target levels of 23.6%, 38.2%, 50%, 61.8%, 100% only, without the failed deals.<br />
32.46 *<br />
[55.10]<br />
3.77<br />
[7.69]<br />
18.84<br />
[28.00]<br />
27.59<br />
[32.93]<br />
29.65<br />
[36.89]<br />
71.05<br />
[79.13]<br />
8.81<br />
[10.95]<br />
Results for the Cases That Contain Eight Candles<br />
Inside Filters<br />
Table 7 shows that the success rate in accessing one of the<br />
target levels was 70.75%, with a profit rate ranging from +3.12%<br />
to +26.85%, and the rate of the time period to access the target<br />
levels ranged from 5 to 178 trading days. On the other hand, the<br />
failure rate to access one of the target levels was 29.25%, with a<br />
loss rate ranging from -3.98% to -4.47%, and the rate of the time<br />
period to closing below or above the stop loss and failure to access<br />
the target levels was approximately equal to 12 trading days.<br />
Table 7. Statistics for the cases that contain eight<br />
candles inside filters<br />
Target Levels<br />
23.6%<br />
38.2%<br />
50%<br />
61.8%<br />
100%<br />
Failed<br />
Deals<br />
Bullish 62<br />
Number<br />
of Deals<br />
133<br />
The Deals<br />
Ratio (%)<br />
(of Total)<br />
11.70%<br />
Bearish 71 13.40%<br />
Bullish 25<br />
55<br />
4.72%<br />
Bearish 30 5.66%<br />
Bullish 19<br />
29<br />
3.58%<br />
Bearish 10 1.89%<br />
Bullish 24<br />
57<br />
4.53%<br />
Bearish 33 6.23%<br />
Bullish 74<br />
101<br />
13.96%<br />
Bearish 27 5.09%<br />
Bullish 66<br />
155<br />
12.45%<br />
Bearish 89 16.79%<br />
25.09%<br />
10.38%<br />
5.47%<br />
10.75%<br />
19.06%<br />
29.25%<br />
Average of<br />
Profit/Loss Ratio<br />
of the Deals (%)<br />
[Std. Dev.]<br />
+3.12%<br />
[2.05]<br />
+4.02%<br />
[5.56]<br />
+10.75%<br />
[9.02]<br />
+7.70%<br />
[4.55]<br />
+9.14%<br />
[2.99]<br />
+10.77%<br />
[6.29]<br />
+17.35%<br />
[14.14]<br />
+16.26%<br />
[10.89]<br />
+24.07%<br />
[15.47]<br />
+26.85%<br />
[18.98]<br />
-4.47%<br />
[4.01]<br />
-3.98%<br />
[2.49]<br />
+3.60%<br />
[4.32[<br />
+9.08%<br />
[7.11]<br />
+9.70%<br />
[4.49]<br />
+16.72%<br />
[12.38]<br />
+24.81%<br />
[16.53]<br />
-4.19%<br />
[3.23]<br />
Risk/Reward<br />
Ratio (Depending<br />
on Failed Deals)<br />
[Std. Dev.]<br />
0.70<br />
[0.46]<br />
1.01<br />
[1.40]<br />
2.40<br />
[2.02]<br />
1.94<br />
[1.14]<br />
2.04<br />
[0.67]<br />
2.71<br />
[1.58]<br />
3.88<br />
[3.16]<br />
4.09<br />
[2.74]<br />
5.38<br />
[3.46]<br />
6.75<br />
[4.77]<br />
1.00<br />
[0.90]<br />
1.00<br />
[0.63]<br />
0.87<br />
[1.08]<br />
2.15<br />
[1.62]<br />
2.27<br />
[1.12]<br />
4.00<br />
[2.93]<br />
5.75<br />
[3.90]<br />
1.00<br />
[0.75]<br />
Average of<br />
Duration of<br />
Deals (Days)<br />
[Std. Dev.]<br />
4.95<br />
[8.34]<br />
6.93<br />
[9.55]<br />
15.24<br />
[9.98]<br />
18.97<br />
[19.35]<br />
29.95<br />
[25.01]<br />
37.60<br />
[53.95]<br />
77.08<br />
[105.84]<br />
66.73<br />
[99.03]<br />
92.20<br />
[141.48]<br />
178<br />
[206.33]<br />
13.26<br />
[16.24]<br />
11.19<br />
[10.77]<br />
530 100%<br />
+12.59%<br />
Summary<br />
*<br />
2.95 *<br />
49.00 *<br />
(Total) (Total)<br />
[13.65]<br />
[3.20]<br />
[106.02]<br />
* The average of the target levels of 23.6%, 38.2%, 50%, 61.8%, 100% only, without the failed deals.<br />
6.01<br />
[9.06]<br />
17.27<br />
[15.91]<br />
32.59<br />
[37.77]<br />
71.09<br />
[102.08]<br />
115.14<br />
[165.80]<br />
12.07<br />
[13.42]<br />
IFTA.ORG PAGE 89