


Create successful ePaper yourself
Turn your PDF publications into a flip-book with our unique Google optimized e-Paper software.
IFTA JOURNAL<br />
2017 EDITION<br />
Table 2. F rench CAC 40 Index—Two-Month Bar Chart Divergence Signal Analysis<br />
NOTE: From 1990 to 2015 the French CAC 40 Index triggered five divergence signals in a two-month bar chart. Three signals were ‘Sell’ signals and two were ‘Buy’<br />
signals. One signal remains open, as the signal remains active in current markets. Of the four closed signals, three passed and one failed because the divergence signal<br />
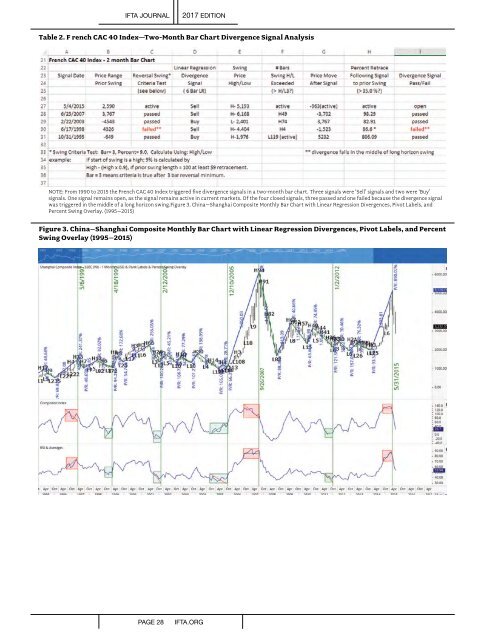
was triggered in the middle of a long horizon swing.Figure 3. China–Shanghai Composite Monthly Bar Chart with Linear Regression Divergences, Pivot Labels, and<br />
Percent Swing Overlay. (1995–2015)<br />
Figure 3. China–Shanghai Composite Monthly Bar Chart with Linear Regression Divergences, Pivot Labels, and Percent<br />
Swing Overlay (1995–2015)<br />
PAGE 28<br />
IFTA.ORG