


You also want an ePaper? Increase the reach of your titles
YUMPU automatically turns print PDFs into web optimized ePapers that Google loves.
IFTA JOURNAL<br />
2017 EDITION<br />
JGB futures<br />
Analysis results for JGB futures are mentioned below.<br />
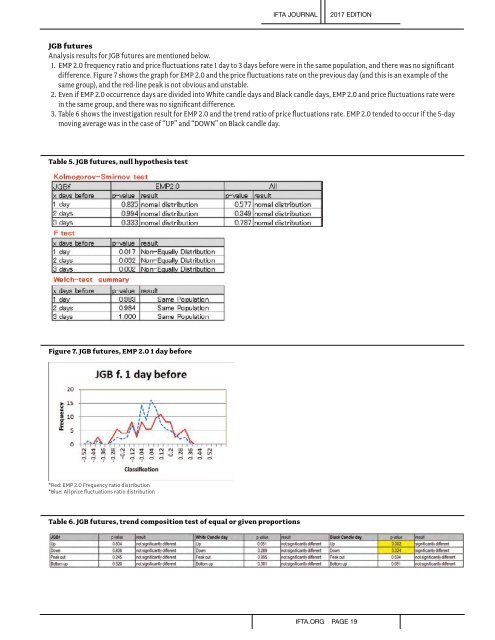
1. EMP 2.0 frequency ratio and price fluctuations rate 1 day to 3 days before were in the same population, and there was no significant<br />
difference. Figure 7 shows the graph for EMP 2.0 and the price fluctuations rate on the previous day (and this is an example of the<br />
same group), and the red-line peak is not obvious and unstable.<br />
2. Even if EMP 2.0 occurrence days are divided into White candle days and Black candle days, EMP 2.0 and price fluctuations rate were<br />
in the same group, and there was no significant difference.<br />
3. Table 6 shows the investigation result for EMP 2.0 and the trend ratio of price fluctuations rate. EMP 2.0 tended to occur if the 5-day<br />
moving average was in the case of “UP” and “DOWN” on Black candle day.<br />
Table 5. JGB futures, null hypothesis test<br />
Figure 7. JGB futures, EMP 2.0 1 day before<br />
*Red: EMP 2.0 Frequency ratio distribution<br />
*Blue: All price fluctuations ratio distribution<br />
Table 6. JGB futures, trend composition test of equal or given proportions<br />
IFTA.ORG PAGE 19