


Create successful ePaper yourself
Turn your PDF publications into a flip-book with our unique Google optimized e-Paper software.
IFTA JOURNAL<br />
2017 EDITION<br />
The Composite Index can be used for developing Elliott Wave<br />
Principle 5 patterns. The Composite Index will form the maximum<br />
displacement at a third-of-third Elliott wave. The divergence<br />
comes with the fifth of a third wave. A second divergence with the<br />
third oscillator peaks at the final fifth wave. This has been a major<br />
help for the author for many years.<br />
Many investors and traders couple RSI with MACD. The<br />
purpose and expectation for this is to use the faster oscillating<br />
RSI against the longer MACD to improve timing. However, the<br />
failure of RSI to develop divergence signals at critical junctions is<br />
a problem for them.<br />
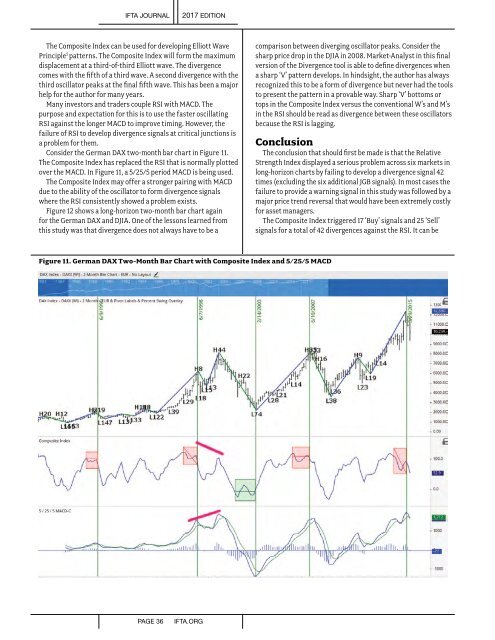
Consider the German DAX two-month bar chart in Figure 11.<br />
The Composite Index has replaced the RSI that is normally plotted<br />
over the MACD. In Figure 11, a 5/25/5 period MACD is being used.<br />
The Composite Index may offer a stronger pairing with MACD<br />
due to the ability of the oscillator to form divergence signals<br />
where the RSI consistently showed a problem exists.<br />
Figure 12 shows a long-horizon two-month bar chart again<br />
for the German DAX and DJIA. One of the lessons learned from<br />
this study was that divergence does not always have to be a<br />
comparison between diverging oscillator peaks. Consider the<br />
sharp price drop in the DJIA in 2008. Market-Analyst in this final<br />
version of the Divergence tool is able to define divergences when<br />
a sharp ‘V’ pattern develops. In hindsight, the author has always<br />
recognized this to be a form of divergence but never had the tools<br />
to present the pattern in a provable way. Sharp ‘V’ bottoms or<br />
tops in the Composite Index versus the conventional W’s and M’s<br />
in the RSI should be read as divergence between these oscillators<br />
because the RSI is lagging.<br />
Conclusion<br />
The conclusion that should first be made is that the Relative<br />
Strength Index displayed a serious problem across six markets in<br />
long-horizon charts by failing to develop a divergence signal 42<br />
times (excluding the six additional JGB signals). In most cases the<br />
failure to provide a warning signal in this study was followed by a<br />
major price trend reversal that would have been extremely costly<br />
for asset managers.<br />
The Composite Index triggered 17 ‘Buy’ signals and 25 ‘Sell’<br />
signals for a total of 42 divergences against the RSI. It can be<br />
Figure 11. German DAX Two-Month Bar Chart with Composite Index and 5/25/5 MACD<br />
PAGE 36<br />
IFTA.ORG