


Create successful ePaper yourself
Turn your PDF publications into a flip-book with our unique Google optimized e-Paper software.
IFTA JOURNAL<br />
2017 EDITION<br />
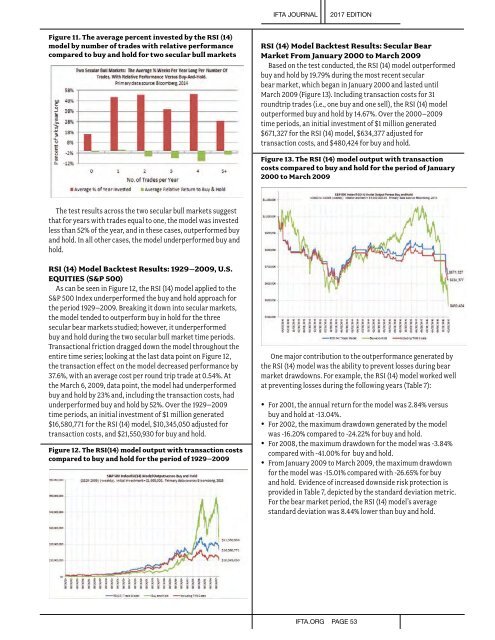
Figure 11. The average percent invested by the RSI (14)<br />
model by number of trades with relative performance<br />
compared to buy and hold for two secular bull markets<br />
RSI (14) Model Backtest Results: Secular Bear<br />
Market From January 2000 to March 2009<br />
Based on the test conducted, the RSI (14) model outperformed<br />
buy and hold by 19.79% during the most recent secular<br />
bear market, which began in January 2000 and lasted until<br />
March 2009 (Figure 13). Including transaction costs for 31<br />
roundtrip trades (i.e., one buy and one sell), the RSI (14) model<br />
outperformed buy and hold by 14.67%. Over the 2000–2009<br />
time periods, an initial investment of $1 million generated<br />
$671,327 for the RSI (14) model, $634,377 adjusted for<br />
transaction costs, and $480,424 for buy and hold.<br />
Figure 13. The RSI (14) model output with transaction<br />
costs compared to buy and hold for the period of January<br />
2000 to March 2009<br />
The test results across the two secular bull markets suggest<br />
that for years with trades equal to one, the model was invested<br />
less than 52% of the year, and in these cases, outperformed buy<br />
and hold. In all other cases, the model underperformed buy and<br />
hold.<br />
RSI (14) Model Backtest Results: 1929–2009, U.S.<br />
EQUITIES (S&P 500)<br />
As can be seen in Figure 12, the RSI (14) model applied to the<br />
S&P 500 Index underperformed the buy and hold approach for<br />
the period 1929–2009. Breaking it down into secular markets,<br />
the model tended to outperform buy in hold for the three<br />
secular bear markets studied; however, it underperformed<br />
buy and hold during the two secular bull market time periods.<br />
Transactional friction dragged down the model throughout the<br />
entire time series; looking at the last data point on Figure 12,<br />
the transaction effect on the model decreased performance by<br />
37.6%, with an average cost per round trip trade at 0.54%. At<br />
the March 6, 2009, data point, the model had underperformed<br />
buy and hold by 23% and, including the transaction costs, had<br />
underperformed buy and hold by 52%. Over the 1929–2009<br />
time periods, an initial investment of $1 million generated<br />
$16,580,771 for the RSI (14) model, $10,345,050 adjusted for<br />
transaction costs, and $21,550,930 for buy and hold.<br />
Figure 12. The RSI(14) model output with transaction costs<br />
compared to buy and hold for the period of 1929–2009<br />
One major contribution to the outperformance generated by<br />
the RSI (14) model was the ability to prevent losses during bear<br />
market drawdowns. For example, the RSI (14) model worked well<br />
at preventing losses during the following years (Table 7):<br />
• For 2001, the annual return for the model was 2.84% versus<br />
buy and hold at -13.04%. <br />
• For 2002, the maximum drawdown generated by the model<br />
was -16.20% compared to -24.22% for buy and hold. <br />
• For 2008, the maximum drawdown for the model was -3.84%<br />
compared with -41.00% for buy and hold. <br />
• From January 2009 to March 2009, the maximum drawdown<br />
for the model was -15.01% compared with -26.65% for buy<br />
and hold. Evidence of increased downside risk protection is<br />
provided in Table 7, depicted by the standard deviation metric.<br />
For the bear market period, the RSI (14) model’s average<br />
standard deviation was 8.44% lower than buy and hold. <br />
IFTA.ORG PAGE 53