


You also want an ePaper? Increase the reach of your titles
YUMPU automatically turns print PDFs into web optimized ePapers that Google loves.
IFTA JOURNAL<br />
2017 EDITION<br />
The RSI (14) model generated 54 sets of buy/sell trades for<br />
the May 1942 to January 1966 time period. The model’s batting<br />
average for success against buy and hold was 22.64%, with<br />
an average trade return at 3.73% compared to buy and hold<br />
at 5.71%. Standard deviation for the model based on trading<br />
data was modestly lower at 10.31% compared to 12.87% for buy<br />
and hold. Maximum drawdown from the trades for the model<br />
was at -7.12% compared to buy and hold at -19.29%, while the<br />
maximum return for the model was 42.70% compared to 51.04%<br />
for buy and hold. The model was long 56% of the time during the<br />
1942–1966 time period (Table 14).<br />
(i.e., one buy and one sell), the RSI (14) model underperformed<br />
buy and hold by 1176.07%. Over the 1978 to 2000 time period,<br />
an initial investment of $1 million generated $3,230,129 for the<br />
RSI (14) model, $2,118,926 adjusted for transaction costs, and<br />
$15,517,369 for buy and hold.<br />
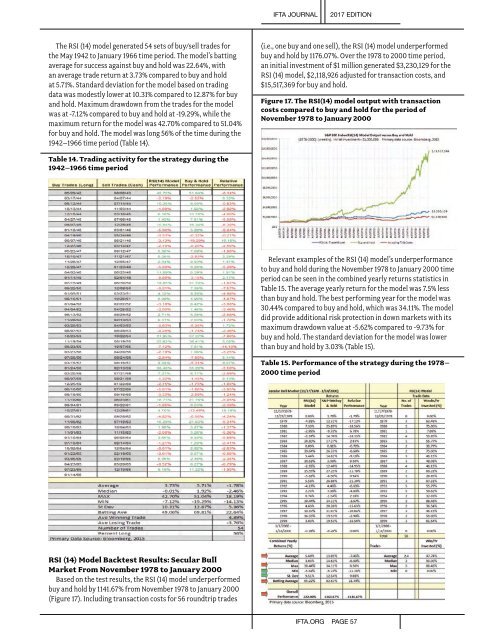
Figure 17. The RSI(14) model output with transaction<br />
costs compared to buy and hold for the period of<br />
November 1978 to January 2000<br />
Table 14. Trading activity for the strategy during the<br />
1942–1966 time period<br />
Relevant examples of the RSI (14) model’s underperformance<br />
to buy and hold during the November 1978 to January 2000 time<br />
period can be seen in the combined yearly returns statistics in<br />
Table 15. The average yearly return for the model was 7.5% less<br />
than buy and hold. The best performing year for the model was<br />
30.44% compared to buy and hold, which was 34.11%. The model<br />
did provide additional risk protection in down markets with its<br />
maximum drawdown value at -5.62% compared to -9.73% for<br />
buy and hold. The standard deviation for the model was lower<br />
than buy and hold by 3.03% (Table 15).<br />
Table 15. Performance of the strategy during the 1978–<br />
2000 time period<br />
RSI (14) Model Backtest Results: Secular Bull<br />
Market From November 1978 to January 2000<br />
Based on the test results, the RSI (14) model underperformed<br />
buy and hold by 1141.67% from November 1978 to January 2000<br />
(Figure 17). Including transaction costs for 56 roundtrip trades<br />
IFTA.ORG PAGE 57